install.packages("compareGroups") compareGroups-描述性表一快速生成
R包
表格
第95期 R语言教程!compareGroups神包制作描述性表一
描述性表1在论文写作中占据着开篇起笔的作用。对所用的数据进行描述和简单分析,为后续的模型构建提供数据可靠性信息
本期介绍如何使用compareGroups神包来快速生成符合学术规范的表1。并进行包括以下自定义设置:1.设置亚组 2.设置非正态变量使用非参组间检验 3.设置显示缺失值 4.设置显示OR值 5.设置使用自定义组间比较方法 6 数据导出
R包介绍
compareGroups 是一个在 CRAN 上可用的 R 包,它可以生成描述性表格,展示几个变量的均值、标准差、分位数或频率。此外,还会使用适当的测试计算 p 值来检验组间差异。
通过简单的代码,就能在 R 中生成美观、规范且可直接用于论文发表的描述性表格。这些表格还可以导出到不同的格式,如 Word、Excel、PDF,或插入到 R-Sweave 或 R-markdown 文档中。
在手册 https://cran.r-project.org/web/packages/compareGroups/vignettes/compareGroups_vignette.html里提供了非常友好的R包教程,描述了 compareGroups 的所有功能,并附有实际示例。
R包安装
从CRAN中安装R包
或者从github安装最新版本
library(devtools)
devtools::install_github("isubirana/compareGroups")
R包参数
查看数据
(不重要可以不看,知道是包含多种数据类型的数据集即可)调用R包自带的regicor数据,包含25个变量。regicor(吉罗纳心脏登记)研究是一项横断面研究,参与者来自西班牙东北部地区。在此研究中,收集了参与者的各种数据集,包括人口统计信息(如年龄和性别)、人体测量数据(如身高、体重和腰围)以及脂质水平(包括总胆固醇和甘油三酯)。此外,参与者还完成了涵盖体育活动和生活质量等领域的问卷。
为了追踪健康结果,研究还收集了关于心血管事件和死亡的数据。这些信息是通过医院和官方登记册及报告,在超过10年的时间里获得的。
library(compareGroups)
library(bruceR) #之前有介绍过,方便描述数据
# 方便起见,我们只分析前十个变量
data("regicor")
regicor <- regicor[,1:10]
str(regicor)'data.frame': 2294 obs. of 10 variables:
$ id : num 2.26e+03 1.88e+03 3.00e+09 3.00e+09 3.00e+09 ...
..- attr(*, "label")= Named chr "Individual id"
.. ..- attr(*, "names")= chr "id"
$ year : Factor w/ 3 levels "1995","2000",..: 3 3 2 2 2 2 2 1 3 1 ...
..- attr(*, "label")= Named chr "Recruitment year"
.. ..- attr(*, "names")= chr "year"
$ age : int 70 56 37 69 70 40 66 53 43 70 ...
..- attr(*, "label")= Named chr "Age"
.. ..- attr(*, "names")= chr "age"
$ sex : Factor w/ 2 levels "Male","Female": 2 2 1 2 2 2 1 2 2 1 ...
..- attr(*, "label")= chr "Sex"
$ smoker : Factor w/ 3 levels "Never smoker",..: 1 1 2 1 NA 2 1 1 3 3 ...
..- attr(*, "label")= Named chr "Smoking status"
.. ..- attr(*, "names")= chr "smoker"
$ sbp : int 138 139 132 168 NA 108 120 132 95 142 ...
..- attr(*, "label")= Named chr "Systolic blood pressure"
.. ..- attr(*, "names")= chr "sbp"
$ dbp : int 75 89 82 97 NA 70 72 78 65 78 ...
..- attr(*, "label")= Named chr "Diastolic blood pressure"
.. ..- attr(*, "names")= chr "dbp"
$ histhtn: Factor w/ 2 levels "Yes","No": 2 2 2 2 2 2 1 2 2 2 ...
..- attr(*, "label")= Named chr "History of hypertension"
.. ..- attr(*, "names")= chr "histbp"
$ txhtn : Factor w/ 2 levels "No","Yes": 1 1 1 1 1 1 2 1 1 1 ...
..- attr(*, "label")= chr "Hypertension treatment"
$ chol : num 294 220 245 168 NA NA 298 254 194 188 ...
..- attr(*, "label")= Named chr "Total cholesterol"
.. ..- attr(*, "names")= chr "chol"生成描述性统计表
简单生成一个最简单的描述性统计表,发现定量资料用平均值标准差描述,分类资料用例数和占比描述
descrTable( ~ ., data = regicor)
--------Summary descriptives table ---------
_______________________________________________________
[ALL] N
N=2294
¯¯¯¯¯¯¯¯¯¯¯¯¯¯¯¯¯¯¯¯¯¯¯¯¯¯¯¯¯¯¯¯¯¯¯¯¯¯¯¯¯¯¯¯¯¯¯¯¯¯¯¯¯¯¯
Individual id 1215817624 (1339538686) 2294
Recruitment year: 2294
1995 431 (18.8%)
2000 786 (34.3%)
2005 1077 (46.9%)
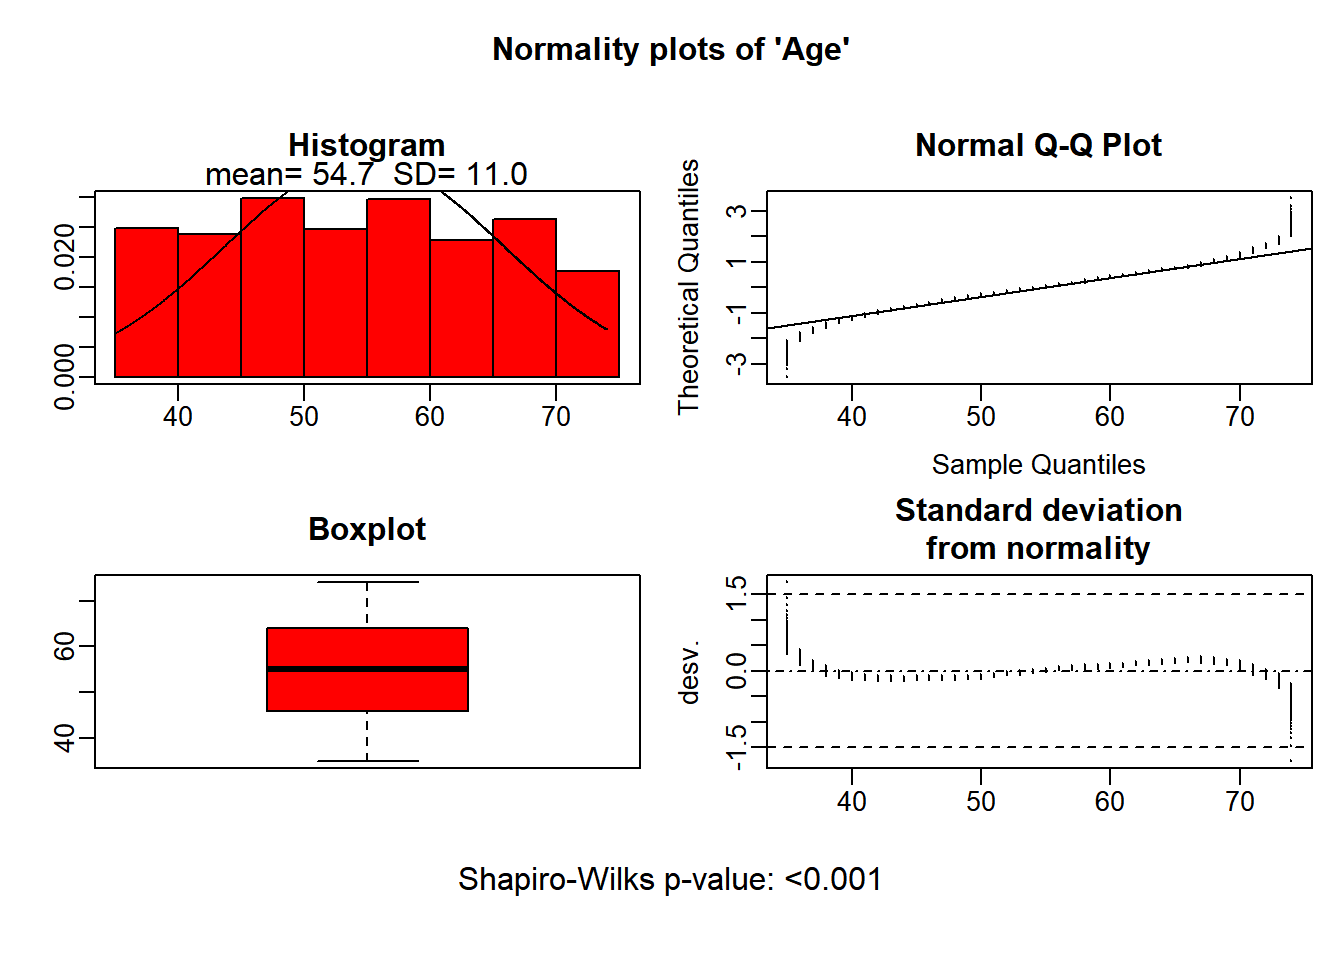
Age 54.7 (11.0) 2294
Sex: 2294
Male 1101 (48.0%)
Female 1193 (52.0%)
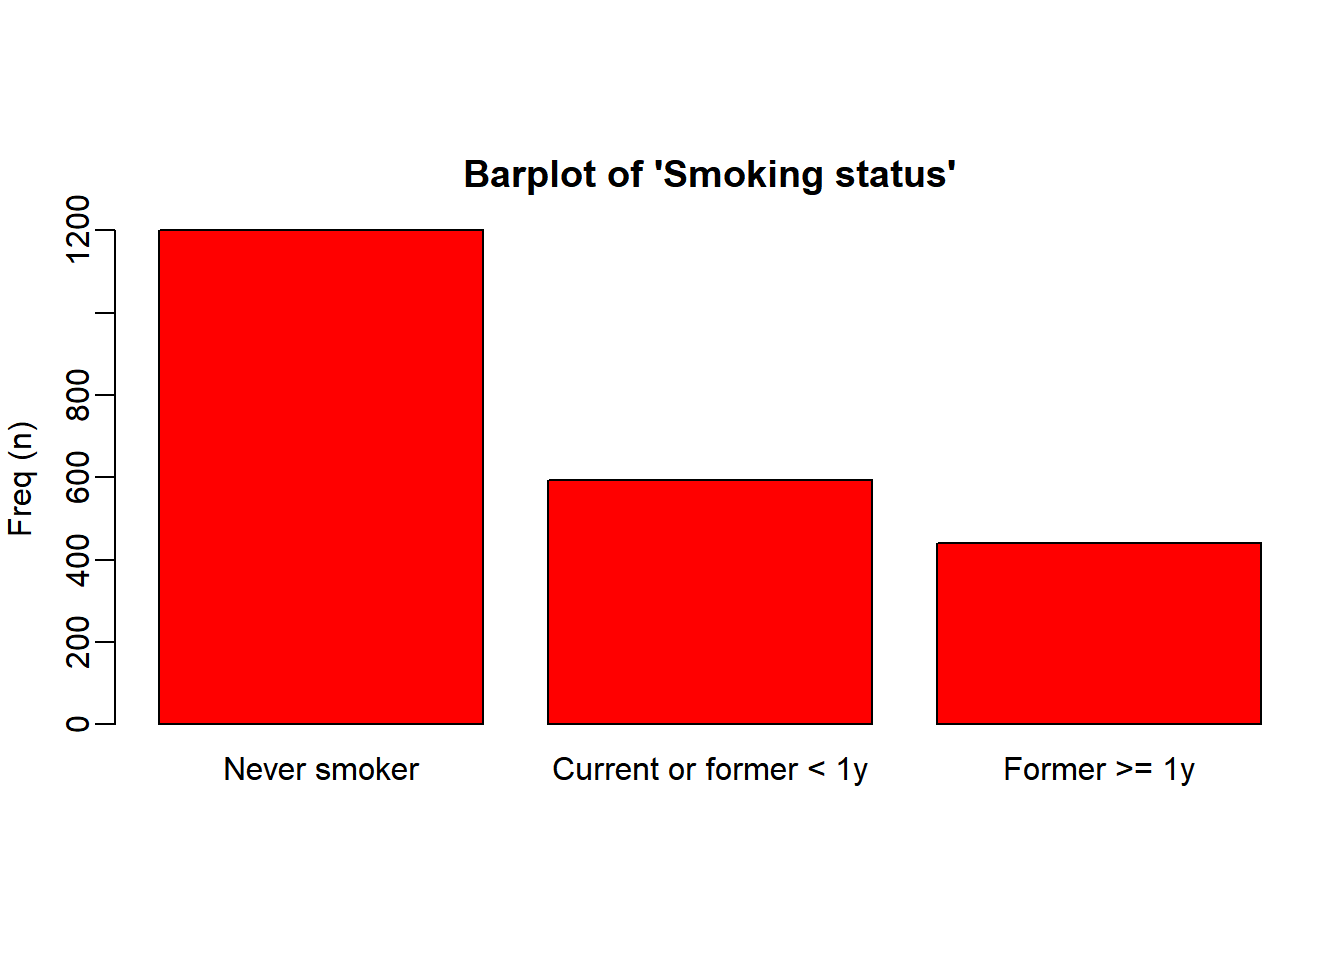
Smoking status: 2233
Never smoker 1201 (53.8%)
Current or former < 1y 593 (26.6%)
Former >= 1y 439 (19.7%)
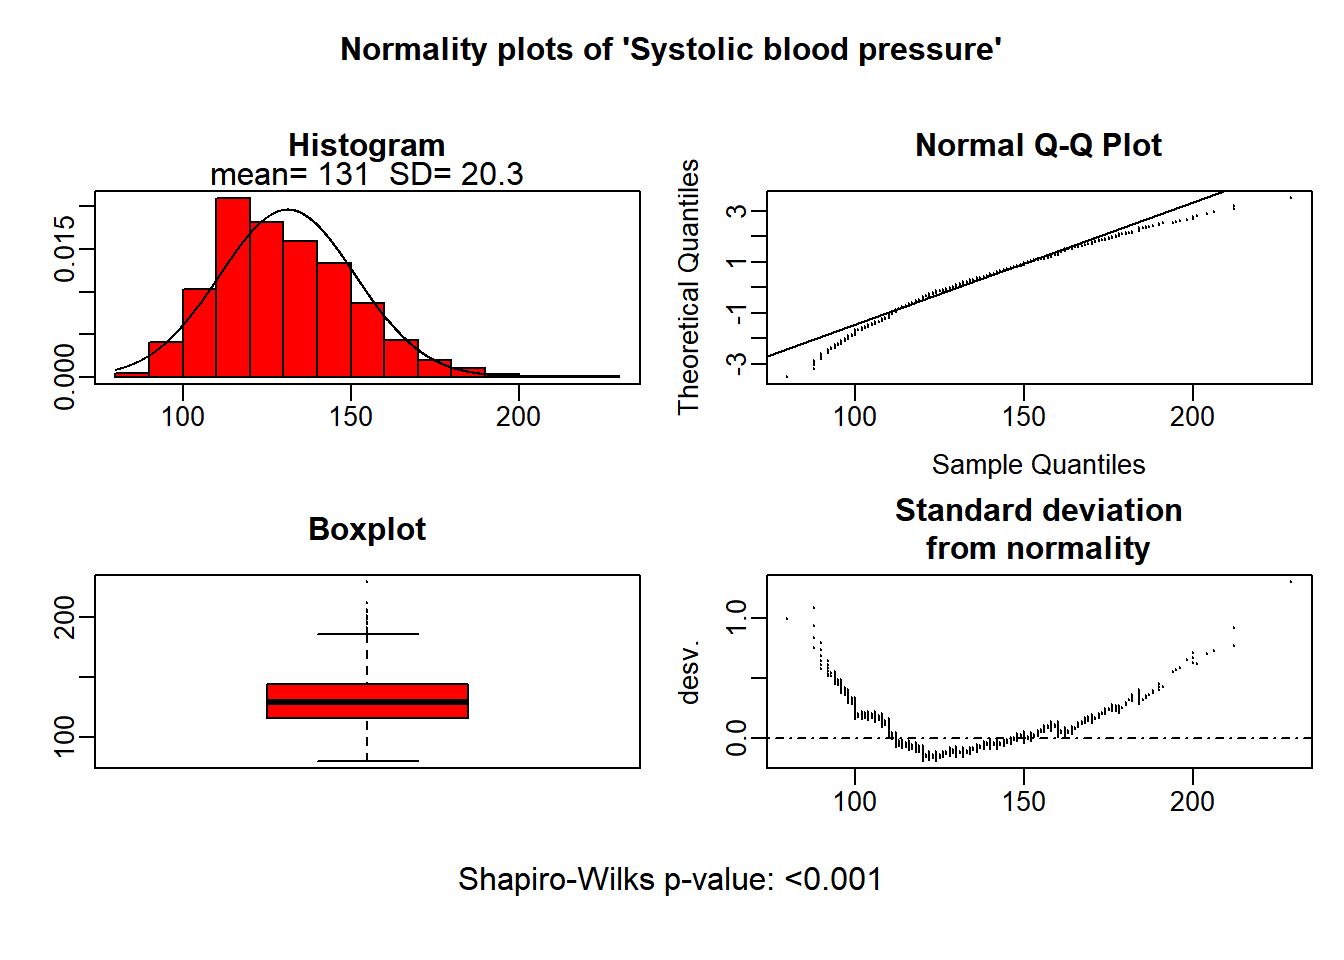
Systolic blood pressure 131 (20.3) 2280
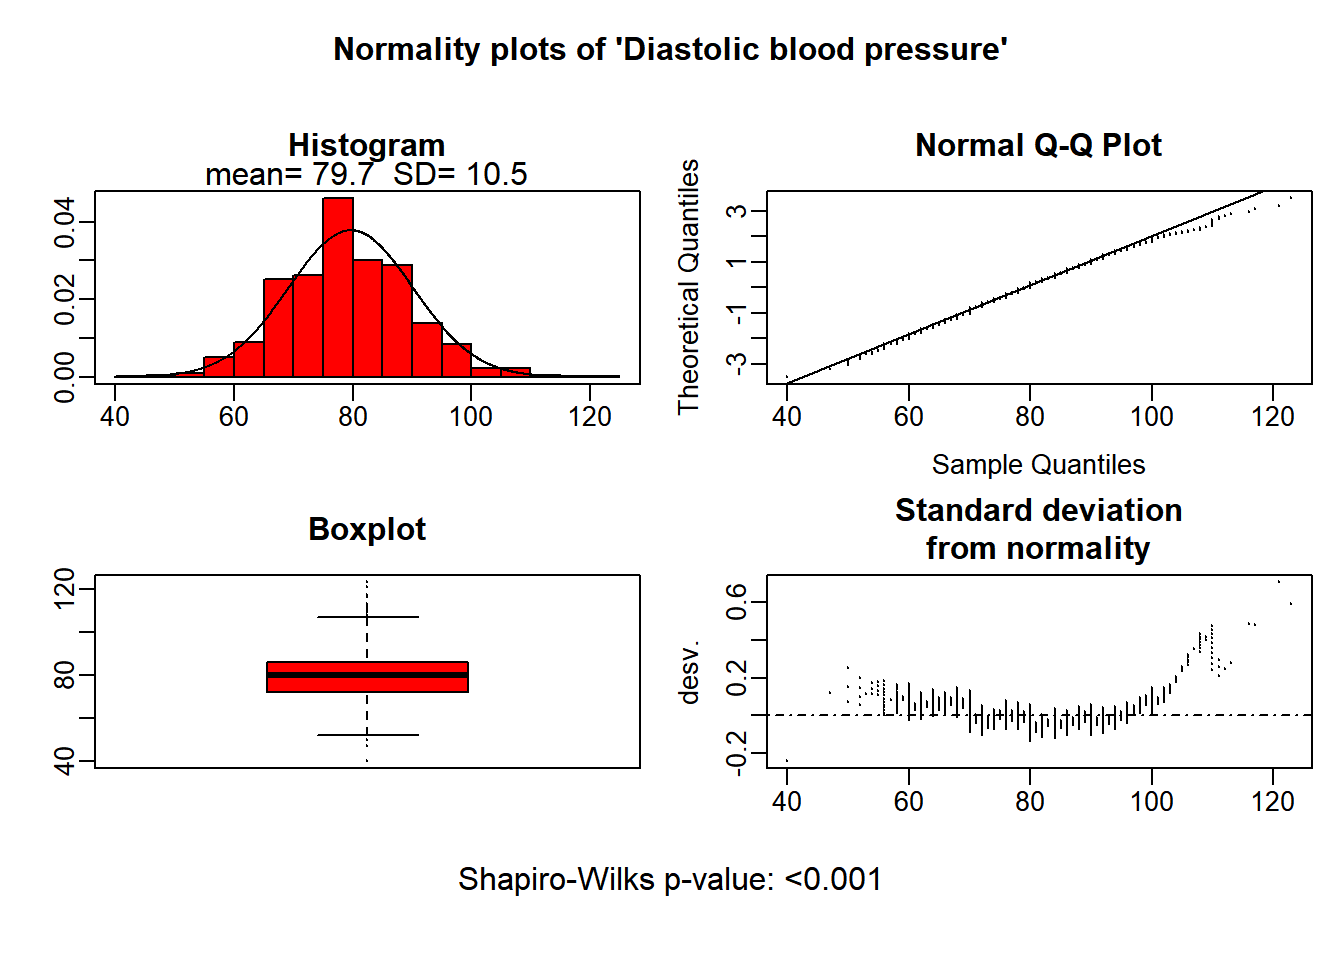
Diastolic blood pressure 79.7 (10.5) 2280
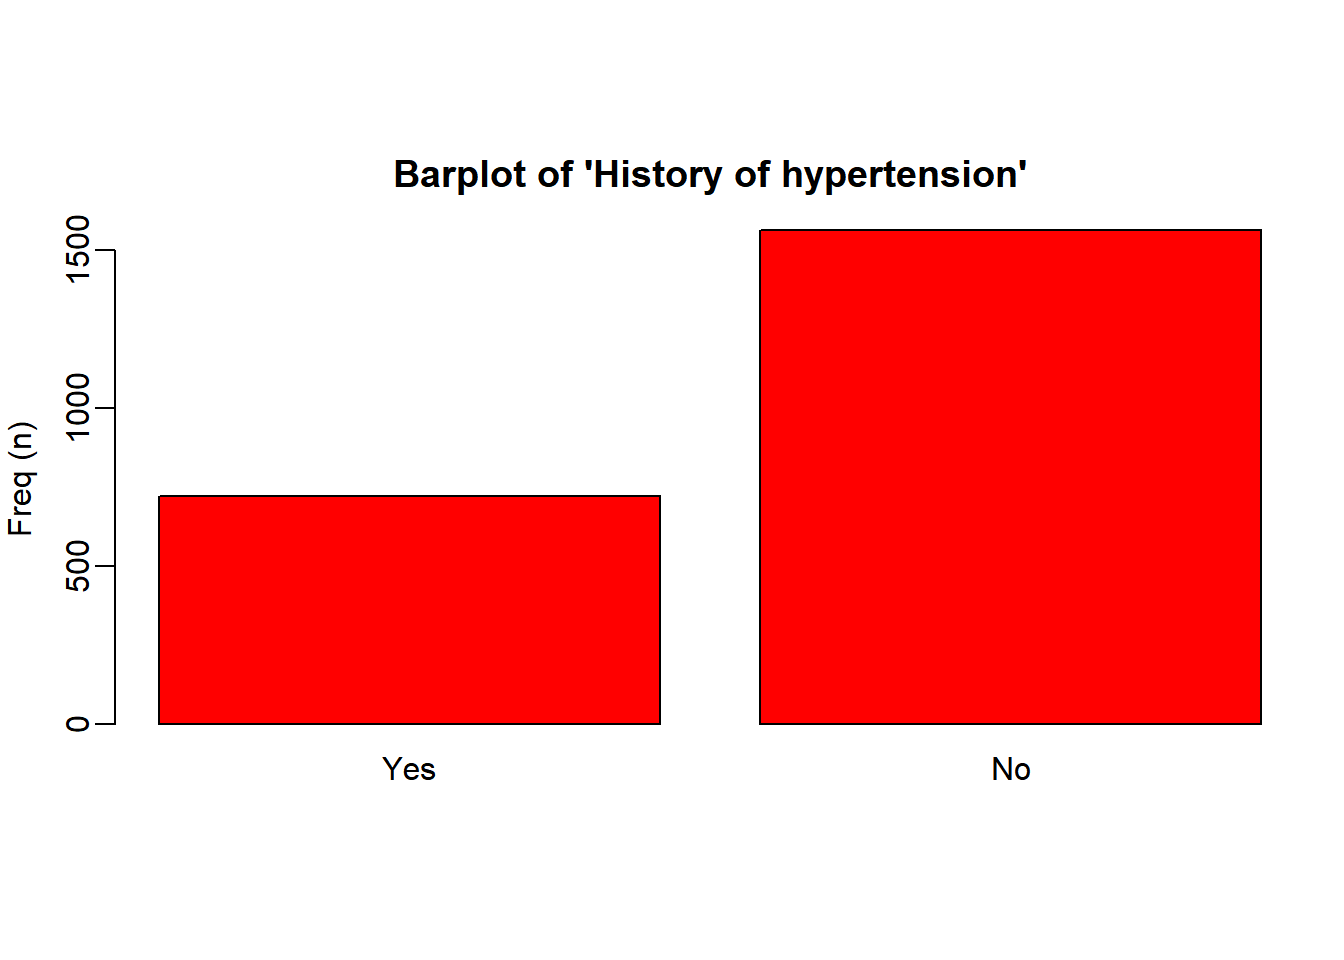
History of hypertension: 2286
Yes 723 (31.6%)
No 1563 (68.4%)
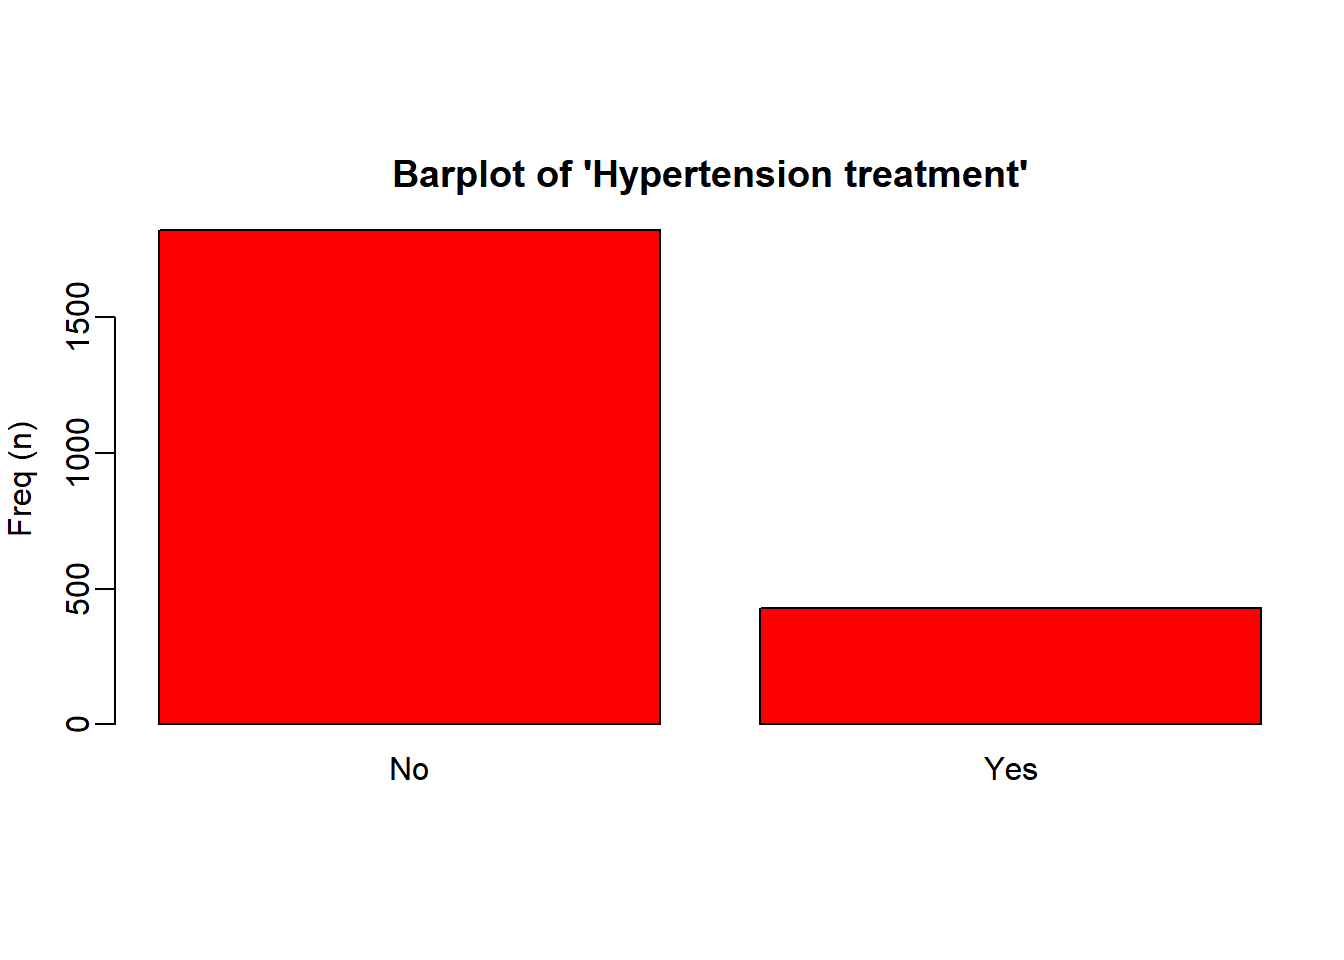
Hypertension treatment: 2251
No 1823 (81.0%)
Yes 428 (19.0%)
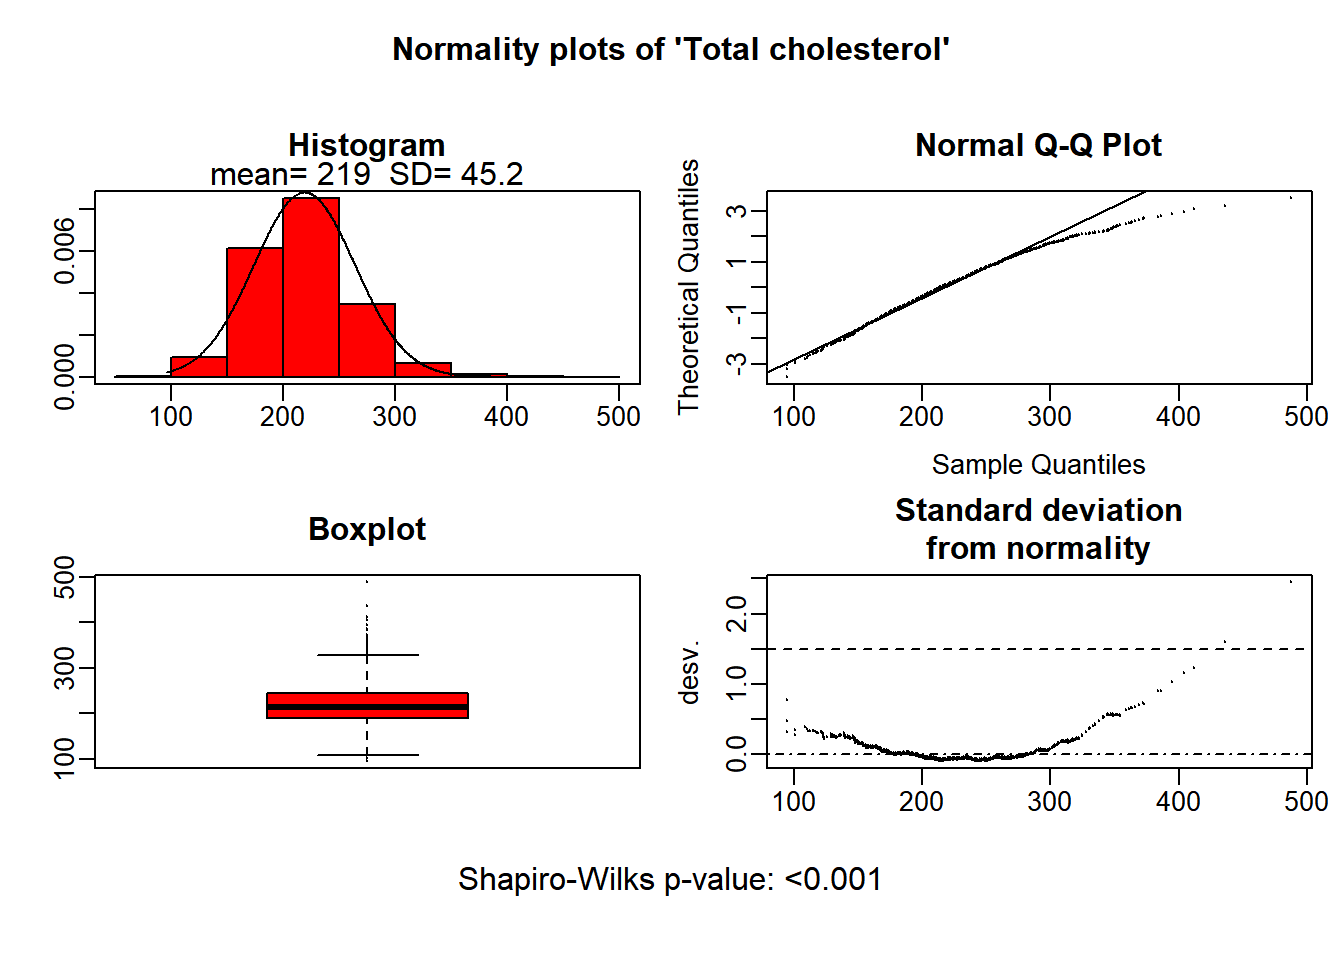
Total cholesterol 219 (45.2) 2193
¯¯¯¯¯¯¯¯¯¯¯¯¯¯¯¯¯¯¯¯¯¯¯¯¯¯¯¯¯¯¯¯¯¯¯¯¯¯¯¯¯¯¯¯¯¯¯¯¯¯¯¯¯¯¯ 设置分组变量
根据吸烟情况将人群分为三组,同时生成组间比较列(p.overall)。自动使用卡方检验(分类变量)和方差分析(计量资料:两类时等价t检验)。
descrTable(`smoker`~ ., data = regicor)
--------Summary descriptives table by 'Smoking status'---------

_________________________________________________________________________________________________________
                              Never smoker       Current or former < 1y       Former >= 1y      p.overall
                                 N=1201                   N=593                  N=439
¯¯¯¯¯¯¯¯¯¯¯¯¯¯¯¯¯¯¯¯¯¯¯¯¯¯¯¯¯¯¯¯¯¯¯¯¯¯¯¯¯¯¯¯¯¯¯¯¯¯¯¯¯¯¯¯¯¯¯¯¯¯¯¯¯¯¯¯¯¯¯¯¯¯¯¯¯¯¯¯¯¯¯¯¯¯¯¯¯¯¯¯¯¯¯¯¯¯¯¯¯¯¯¯¯
Individual id            1229013133 (1337342152) 1534618659 (1372769742) 690225475 (1126583145)  <0.001
Recruitment year:                                                                                <0.001
    1995                       234 (19.5%)             109 (18.4%)             72 (16.4%)
    2000                       414 (34.5%)             267 (45.0%)             77 (17.5%)
    2005                       553 (46.0%)             217 (36.6%)            290 (66.1%)
Age                            56.5 (10.8)             50.6 (10.7)            55.3 (10.6)        <0.001
Sex:                                                                                             <0.001
    Male                       301 (25.1%)             410 (69.1%)            360 (82.0%)
    Female                     900 (74.9%)             183 (30.9%)             79 (18.0%)
Systolic blood pressure        132 (20.5)              128 (19.8)              133 (19.7)        <0.001
Diastolic blood pressure       79.5 (10.2)             78.8 (11.0)            81.2 (10.8)         0.002
History of hypertension:                                                                         <0.001
    Yes                        421 (35.1%)             125 (21.2%)            162 (36.9%)
    No                         777 (64.9%)             464 (78.8%)            277 (63.1%)
Hypertension treatment:                                                                          <0.001
    No                         922 (77.9%)             525 (90.2%)            331 (77.2%)
    Yes                        262 (22.1%)             57 (9.79%)              98 (22.8%)
Total cholesterol              220 (46.7)              219 (44.7)              214 (42.6)         0.030
¯¯¯¯¯¯¯¯¯¯¯¯¯¯¯¯¯¯¯¯¯¯¯¯¯¯¯¯¯¯¯¯¯¯¯¯¯¯¯¯¯¯¯¯¯¯¯¯¯¯¯¯¯¯¯¯¯¯¯¯¯¯¯¯¯¯¯¯¯¯¯¯¯¯¯¯¯¯¯¯¯¯¯¯¯¯¯¯¯¯¯¯¯¯¯¯¯¯¯¯¯¯¯¯¯
删除某些变量不显示
如不希望描述性统计对Id和year进行描述,直接在~右侧的.后使用减号进行删除(如需要的变量比较少,也可以手动写公式一个个加)
descrTable(`smoker`~ .-id-year, data = regicor)
--------Summary descriptives table by 'Smoking status'---------

___________________________________________________________________________________
                         Never smoker Current or former < 1y Former >= 1y p.overall
                            N=1201            N=593             N=439
¯¯¯¯¯¯¯¯¯¯¯¯¯¯¯¯¯¯¯¯¯¯¯¯¯¯¯¯¯¯¯¯¯¯¯¯¯¯¯¯¯¯¯¯¯¯¯¯¯¯¯¯¯¯¯¯¯¯¯¯¯¯¯¯¯¯¯¯¯¯¯¯¯¯¯¯¯¯¯¯¯¯¯
Age                      56.5 (10.8)       50.6 (10.7)       55.3 (10.6)   <0.001
Sex:                                                                       <0.001
    Male                 301 (25.1%)       410 (69.1%)       360 (82.0%)
    Female               900 (74.9%)       183 (30.9%)        79 (18.0%)
Systolic blood pressure   132 (20.5)        128 (19.8)        133 (19.7)   <0.001
Diastolic blood pressure 79.5 (10.2)       78.8 (11.0)       81.2 (10.8)    0.002
History of hypertension:                                                   <0.001
    Yes                  421 (35.1%)       125 (21.2%)       162 (36.9%)
    No                   777 (64.9%)       464 (78.8%)       277 (63.1%)
Hypertension treatment:                                                    <0.001
    No                   922 (77.9%)       525 (90.2%)       331 (77.2%)
    Yes                  262 (22.1%)        57 (9.79%)        98 (22.8%)
Total cholesterol         220 (46.7)        219 (44.7)        214 (42.6)    0.030
¯¯¯¯¯¯¯¯¯¯¯¯¯¯¯¯¯¯¯¯¯¯¯¯¯¯¯¯¯¯¯¯¯¯¯¯¯¯¯¯¯¯¯¯¯¯¯¯¯¯¯¯¯¯¯¯¯¯¯¯¯¯¯¯¯¯¯¯¯¯¯¯¯¯¯¯¯¯¯¯¯¯¯
亚组描述
subset=(逻辑判断)来挑选出男性患者进行分析
descrTable(`smoker`~ .-id-year-sex, data = regicor,
           subset=(sex=="Male"))
--------Summary descriptives table by 'smoker'---------

___________________________________________________________________________________
                         Never smoker Current or former < 1y Former >= 1y p.overall
                            N=301             N=410             N=360
¯¯¯¯¯¯¯¯¯¯¯¯¯¯¯¯¯¯¯¯¯¯¯¯¯¯¯¯¯¯¯¯¯¯¯¯¯¯¯¯¯¯¯¯¯¯¯¯¯¯¯¯¯¯¯¯¯¯¯¯¯¯¯¯¯¯¯¯¯¯¯¯¯¯¯¯¯¯¯¯¯¯¯
Age                      55.0 (11.5)       52.7 (11.0)       56.8 (10.5)   <0.001
Systolic blood pressure   133 (18.5)        133 (19.0)        136 (19.0)    0.050
Diastolic blood pressure 81.3 (9.31)       81.2 (10.6)       82.3 (10.4)    0.263
History of hypertension:                                                   <0.001
    Yes                   85 (28.4%)       101 (24.8%)       145 (40.3%)
    No                   214 (71.6%)       306 (75.2%)       215 (59.7%)
Hypertension treatment:                                                    <0.001
    No                   248 (83.5%)       357 (88.4%)       263 (75.1%)
    Yes                   49 (16.5%)        47 (11.6%)        87 (24.9%)
Total cholesterol         213 (44.0)        221 (41.9)        216 (43.3)    0.061
¯¯¯¯¯¯¯¯¯¯¯¯¯¯¯¯¯¯¯¯¯¯¯¯¯¯¯¯¯¯¯¯¯¯¯¯¯¯¯¯¯¯¯¯¯¯¯¯¯¯¯¯¯¯¯¯¯¯¯¯¯¯¯¯¯¯¯¯¯¯¯¯¯¯¯¯¯¯¯¯¯¯¯
自定义设置分组检验方法
设置mehtod参数值,如果不设置,默认所有变量符合正态分布。修改age为非正态后使用四分位数进行描述,同时使用非参检验进行分组比较
参数值为1:正态分布分析 :此值强制分析假设行变量遵循正态分布。
参数值为2:连续非正态分析 :选择此值意味着分析不假设行变量遵循正态分布,将其视为连续但非正态分布的变量。
参数值为3:分类分析:此值强制分析将行变量视为分类变量,无论其原始类型如何。
参数值为4:Shapiro-Wilks检验 (正态检验):使用此值触发Shapiro-Wilks检验,以确定变量是否应在正态性假设下进行分析,还是非正态。这对于根据数据做出如何处理每个变量的决策非常有用。
# descrTable(`smoker`~ .-id-year, data = regicor,method = 1) 假定所有变量符合正态分布

#设置age变量为非正态,使用非参检验进行比较
descrTable(`sex`~ .-id-year, data = regicor, method=c(age = 2))
--------Summary descriptives table by 'Sex'---------

______________________________________________________________________
                                 Male            Female      p.overall
                                N=1101           N=1193
¯¯¯¯¯¯¯¯¯¯¯¯¯¯¯¯¯¯¯¯¯¯¯¯¯¯¯¯¯¯¯¯¯¯¯¯¯¯¯¯¯¯¯¯¯¯¯¯¯¯¯¯¯¯¯¯¯¯¯¯¯¯¯¯¯¯¯¯¯¯
Age                        54.0 [46.0;64.0] 55.0 [46.0;64.0]   0.851
Smoking status:                                               <0.001
    Never smoker             301 (28.1%)      900 (77.5%)
    Current or former < 1y   410 (38.3%)      183 (15.7%)
    Former >= 1y             360 (33.6%)       79 (6.80%)
Systolic blood pressure       134 (18.9)       129 (21.2)     <0.001
Diastolic blood pressure     81.7 (10.2)      77.8 (10.5)     <0.001
History of hypertension:                                       0.644
    Yes                      341 (31.1%)      382 (32.1%)
    No                       755 (68.9%)      808 (67.9%)
Hypertension treatment:                                        0.096
    No                       889 (82.5%)      934 (79.6%)
    Yes                      189 (17.5%)      239 (20.4%)
Total cholesterol             217 (42.7)       220 (47.4)      0.140
¯¯¯¯¯¯¯¯¯¯¯¯¯¯¯¯¯¯¯¯¯¯¯¯¯¯¯¯¯¯¯¯¯¯¯¯¯¯¯¯¯¯¯¯¯¯¯¯¯¯¯¯¯¯¯¯¯¯¯¯¯¯¯¯¯¯¯¯¯¯
不显示标签label值
有些数据集自带label,可以通过include.label设置是否显示标签
descrTable(`sex`~ .-id-year, data = regicor, include.label= FALSE)
--------Summary descriptives table by 'sex'---------

____________________________________________________________
                              Male       Female    p.overall
                             N=1101      N=1193
¯¯¯¯¯¯¯¯¯¯¯¯¯¯¯¯¯¯¯¯¯¯¯¯¯¯¯¯¯¯¯¯¯¯¯¯¯¯¯¯¯¯¯¯¯¯¯¯¯¯¯¯¯¯¯¯¯¯¯¯
age                        54.8 (11.1) 54.7 (11.0)   0.840
smoker:                                             <0.001
    Never smoker           301 (28.1%) 900 (77.5%)
    Current or former < 1y 410 (38.3%) 183 (15.7%)
    Former >= 1y           360 (33.6%) 79 (6.80%)
sbp                        134 (18.9)  129 (21.2)   <0.001
dbp                        81.7 (10.2) 77.8 (10.5)  <0.001
histhtn:                                             0.644
    Yes                    341 (31.1%) 382 (32.1%)
    No                     755 (68.9%) 808 (67.9%)
txhtn:                                               0.096
    No                     889 (82.5%) 934 (79.6%)
    Yes                    189 (17.5%) 239 (20.4%)
chol                       217 (42.7)  220 (47.4)    0.140
¯¯¯¯¯¯¯¯¯¯¯¯¯¯¯¯¯¯¯¯¯¯¯¯¯¯¯¯¯¯¯¯¯¯¯¯¯¯¯¯¯¯¯¯¯¯¯¯¯¯¯¯¯¯¯¯¯¯¯¯
设置计量资料用四分位法描述
设置Q1参数和Q3参数设置如何描述非正态连续变量。如果设置成0和1就是最小值最大值描述
descrTable(`sex`~ .-id-year, data = regicor,method = c(age=2),
           Q1=0.025, Q3=0.975)
--------Summary descriptives table by 'Sex'---------

______________________________________________________________________
                                 Male            Female      p.overall
                                N=1101           N=1193
¯¯¯¯¯¯¯¯¯¯¯¯¯¯¯¯¯¯¯¯¯¯¯¯¯¯¯¯¯¯¯¯¯¯¯¯¯¯¯¯¯¯¯¯¯¯¯¯¯¯¯¯¯¯¯¯¯¯¯¯¯¯¯¯¯¯¯¯¯¯
Age                        54.0 [36.0;73.0] 55.0 [36.0;73.0]   0.851
Smoking status:                                               <0.001
    Never smoker             301 (28.1%)      900 (77.5%)
    Current or former < 1y   410 (38.3%)      183 (15.7%)
    Former >= 1y             360 (33.6%)       79 (6.80%)
Systolic blood pressure       134 (18.9)       129 (21.2)     <0.001
Diastolic blood pressure     81.7 (10.2)      77.8 (10.5)     <0.001
History of hypertension:                                       0.644
    Yes                      341 (31.1%)      382 (32.1%)
    No                       755 (68.9%)      808 (67.9%)
Hypertension treatment:                                        0.096
    No                       889 (82.5%)      934 (79.6%)
    Yes                      189 (17.5%)      239 (20.4%)
Total cholesterol             217 (42.7)       220 (47.4)      0.140
¯¯¯¯¯¯¯¯¯¯¯¯¯¯¯¯¯¯¯¯¯¯¯¯¯¯¯¯¯¯¯¯¯¯¯¯¯¯¯¯¯¯¯¯¯¯¯¯¯¯¯¯¯¯¯¯¯¯¯¯¯¯¯¯¯¯¯¯¯¯
生成OR和HR值
使用show.ratio变量来显示OR值,对于变量类型是time-to-event变量则输出HR值
descrTable(`sex`~ .-id-year, data = regicor,show.ratio = TRUE)
--------Summary descriptives table by 'Sex'---------

_____________________________________________________________________________________
                              Male       Female           OR        p.ratio p.overall
                             N=1101      N=1193
¯¯¯¯¯¯¯¯¯¯¯¯¯¯¯¯¯¯¯¯¯¯¯¯¯¯¯¯¯¯¯¯¯¯¯¯¯¯¯¯¯¯¯¯¯¯¯¯¯¯¯¯¯¯¯¯¯¯¯¯¯¯¯¯¯¯¯¯¯¯¯¯¯¯¯¯¯¯¯¯¯¯¯¯¯
Age                        54.8 (11.1) 54.7 (11.0) 1.00 [0.99;1.01]  0.840    0.840
Smoking status:                                                              <0.001
    Never smoker           301 (28.1%) 900 (77.5%)       Ref.        Ref.
    Current or former < 1y 410 (38.3%) 183 (15.7%) 0.15 [0.12;0.19]  0.000
    Former >= 1y           360 (33.6%) 79 (6.80%)  0.07 [0.06;0.10]  0.000
Systolic blood pressure    134 (18.9)  129 (21.2)  0.99 [0.98;0.99] <0.001   <0.001
Diastolic blood pressure   81.7 (10.2) 77.8 (10.5) 0.96 [0.96;0.97] <0.001   <0.001
History of hypertension:                                                      0.644
    Yes                    341 (31.1%) 382 (32.1%)       Ref.        Ref.
    No                     755 (68.9%) 808 (67.9%) 0.96 [0.80;1.14]  0.612
Hypertension treatment:                                                       0.096
    No                     889 (82.5%) 934 (79.6%)       Ref.        Ref.
    Yes                    189 (17.5%) 239 (20.4%) 1.20 [0.97;1.49]  0.086
Total cholesterol          217 (42.7)  220 (47.4)  1.00 [1.00;1.00]  0.141    0.140
¯¯¯¯¯¯¯¯¯¯¯¯¯¯¯¯¯¯¯¯¯¯¯¯¯¯¯¯¯¯¯¯¯¯¯¯¯¯¯¯¯¯¯¯¯¯¯¯¯¯¯¯¯¯¯¯¯¯¯¯¯¯¯¯¯¯¯¯¯¯¯¯¯¯¯¯¯¯¯¯¯¯¯¯¯
设置OR值的ref对照
使用ref参数设置变量的ref对照值。代码所示为把smoker的因子level为3(值为”Former>=1y”)的设置为对照组计算其它组的OR值
同样作用的函数还有ref.no 和 ref.y
descrTable(`sex`~ .-id-year, data = regicor,
           include.label = FALSE,show.ratio = TRUE,
           ref = c(smoker=3))
--------Summary descriptives table by 'sex'---------

_____________________________________________________________________________________
                              Male       Female           OR        p.ratio p.overall
                             N=1101      N=1193
¯¯¯¯¯¯¯¯¯¯¯¯¯¯¯¯¯¯¯¯¯¯¯¯¯¯¯¯¯¯¯¯¯¯¯¯¯¯¯¯¯¯¯¯¯¯¯¯¯¯¯¯¯¯¯¯¯¯¯¯¯¯¯¯¯¯¯¯¯¯¯¯¯¯¯¯¯¯¯¯¯¯¯¯¯
age                        54.8 (11.1) 54.7 (11.0) 1.00 [0.99;1.01]  0.840    0.840
smoker:                                                                      <0.001
    Never smoker           301 (28.1%) 900 (77.5%) 13.6 [10.4;18.0]  0.000
    Current or former < 1y 410 (38.3%) 183 (15.7%) 2.03 [1.51;2.75] <0.001
    Former >= 1y           360 (33.6%) 79 (6.80%)        Ref.        Ref.
sbp                        134 (18.9)  129 (21.2)  0.99 [0.98;0.99] <0.001   <0.001
dbp                        81.7 (10.2) 77.8 (10.5) 0.96 [0.96;0.97] <0.001   <0.001
histhtn:                                                                      0.644
    Yes                    341 (31.1%) 382 (32.1%)       Ref.        Ref.
    No                     755 (68.9%) 808 (67.9%) 0.96 [0.80;1.14]  0.612
txhtn:                                                                        0.096
    No                     889 (82.5%) 934 (79.6%)       Ref.        Ref.
    Yes                    189 (17.5%) 239 (20.4%) 1.20 [0.97;1.49]  0.086
chol                       217 (42.7)  220 (47.4)  1.00 [1.00;1.00]  0.141    0.140
¯¯¯¯¯¯¯¯¯¯¯¯¯¯¯¯¯¯¯¯¯¯¯¯¯¯¯¯¯¯¯¯¯¯¯¯¯¯¯¯¯¯¯¯¯¯¯¯¯¯¯¯¯¯¯¯¯¯¯¯¯¯¯¯¯¯¯¯¯¯¯¯¯¯¯¯¯¯¯¯¯¯¯¯¯
不显示对照组的描述信息
使用hide.no来隐藏某些因子水平的描述。常用来隐藏掉2分类变量的否的信息
descrTable(`sex`~ .-id-year, data = regicor,hide.no = "No")
--------Summary descriptives table by 'Sex'---------

____________________________________________________________
                              Male       Female    p.overall
                             N=1101      N=1193
¯¯¯¯¯¯¯¯¯¯¯¯¯¯¯¯¯¯¯¯¯¯¯¯¯¯¯¯¯¯¯¯¯¯¯¯¯¯¯¯¯¯¯¯¯¯¯¯¯¯¯¯¯¯¯¯¯¯¯¯
Age                        54.8 (11.1) 54.7 (11.0)   0.840
Smoking status:                                     <0.001
    Never smoker           301 (28.1%) 900 (77.5%)
    Current or former < 1y 410 (38.3%) 183 (15.7%)
    Former >= 1y           360 (33.6%) 79 (6.80%)
Systolic blood pressure    134 (18.9)  129 (21.2)   <0.001
Diastolic blood pressure   81.7 (10.2) 77.8 (10.5)  <0.001
History of hypertension    341 (31.1%) 382 (32.1%)   0.644
Hypertension treatment     189 (17.5%) 239 (20.4%)   0.096
Total cholesterol          217 (42.7)  220 (47.4)    0.140
¯¯¯¯¯¯¯¯¯¯¯¯¯¯¯¯¯¯¯¯¯¯¯¯¯¯¯¯¯¯¯¯¯¯¯¯¯¯¯¯¯¯¯¯¯¯¯¯¯¯¯¯¯¯¯¯¯¯¯¯
同时显示总人群的描述
descrTable(`sex`~ .-id-year, data = regicor,show.all = TRUE)
--------Summary descriptives table by 'Sex'---------

_________________________________________________________________________
                              [ALL]        Male       Female    p.overall
                              N=2294      N=1101      N=1193
¯¯¯¯¯¯¯¯¯¯¯¯¯¯¯¯¯¯¯¯¯¯¯¯¯¯¯¯¯¯¯¯¯¯¯¯¯¯¯¯¯¯¯¯¯¯¯¯¯¯¯¯¯¯¯¯¯¯¯¯¯¯¯¯¯¯¯¯¯¯¯¯¯
Age                        54.7 (11.0)  54.8 (11.1) 54.7 (11.0)   0.840
Smoking status:                                                  <0.001
    Never smoker           1201 (53.8%) 301 (28.1%) 900 (77.5%)
    Current or former < 1y 593 (26.6%)  410 (38.3%) 183 (15.7%)
    Former >= 1y           439 (19.7%)  360 (33.6%) 79 (6.80%)
Systolic blood pressure     131 (20.3)  134 (18.9)  129 (21.2)   <0.001
Diastolic blood pressure   79.7 (10.5)  81.7 (10.2) 77.8 (10.5)  <0.001
History of hypertension:                                          0.644
    Yes                    723 (31.6%)  341 (31.1%) 382 (32.1%)
    No                     1563 (68.4%) 755 (68.9%) 808 (67.9%)
Hypertension treatment:                                           0.096
    No                     1823 (81.0%) 889 (82.5%) 934 (79.6%)
    Yes                    428 (19.0%)  189 (17.5%) 239 (20.4%)
Total cholesterol           219 (45.2)  217 (42.7)  220 (47.4)    0.140
¯¯¯¯¯¯¯¯¯¯¯¯¯¯¯¯¯¯¯¯¯¯¯¯¯¯¯¯¯¯¯¯¯¯¯¯¯¯¯¯¯¯¯¯¯¯¯¯¯¯¯¯¯¯¯¯¯¯¯¯¯¯¯¯¯¯¯¯¯¯¯¯¯
结果导出
可导出各种格式,export2xls, export2latex, export2pdf, export2csv, export2md, export2word
export2word(tab_0,file="1 data_summary.docx")快速可视化
使用plot函数进行可视化,设置file和type参数进行保存例如
plot(res[c(1,2)], file=“./figures/univar/”, type=“png”)
tab0 <- descrTable(`sex`~ .-id-year, data = regicor)

plot(tab0)