install.packages("ggtext")ggtext:中英文混合字体的完美解决方案
可视化
字体
ggtext 包扩展了 ggplot2 的文本渲染能力,支持 Markdown 和 HTML 语法,是解决中英文字体混合显示的终极方案。
R包介绍
为什么需要 ggtext?
在科研绑图中,我们经常遇到以下问题:
- 中英文混合:标题需要同时显示中文和英文,但字体不统一
- 富文本格式:需要在标签中使用粗体、斜体、颜色等格式
- 上下标:化学式 H₂O、数学公式 R² 等需要特殊格式
- 图例美化:希望图例文字带颜色、格式
ggtext 完美解决了这些问题!
安装与加载
library(ggplot2)
library(ggtext)
library(dplyr)
基础用法:Markdown 文本
element_markdown() 基础
ggtext 的核心函数是 element_markdown(),它替代 element_text() 来渲染富文本。
# 创建示例数据
data <- data.frame(
  category = c("Control", "Treatment A", "Treatment B"),
  value = c(25, 45, 35)
)

# 使用 Markdown 语法的标题
ggplot(data, aes(x = category, y = value, fill = category)) +
  geom_col() +
  labs(
    title = "**实验结果** (*Experimental Results*)",
    x = "分组",
    y = "数值"
  ) +
  theme_minimal() +
  theme(
    plot.title = element_markdown(size = 16, hjust = 0.5)
  ) +
  scale_fill_brewer(palette = "Set2")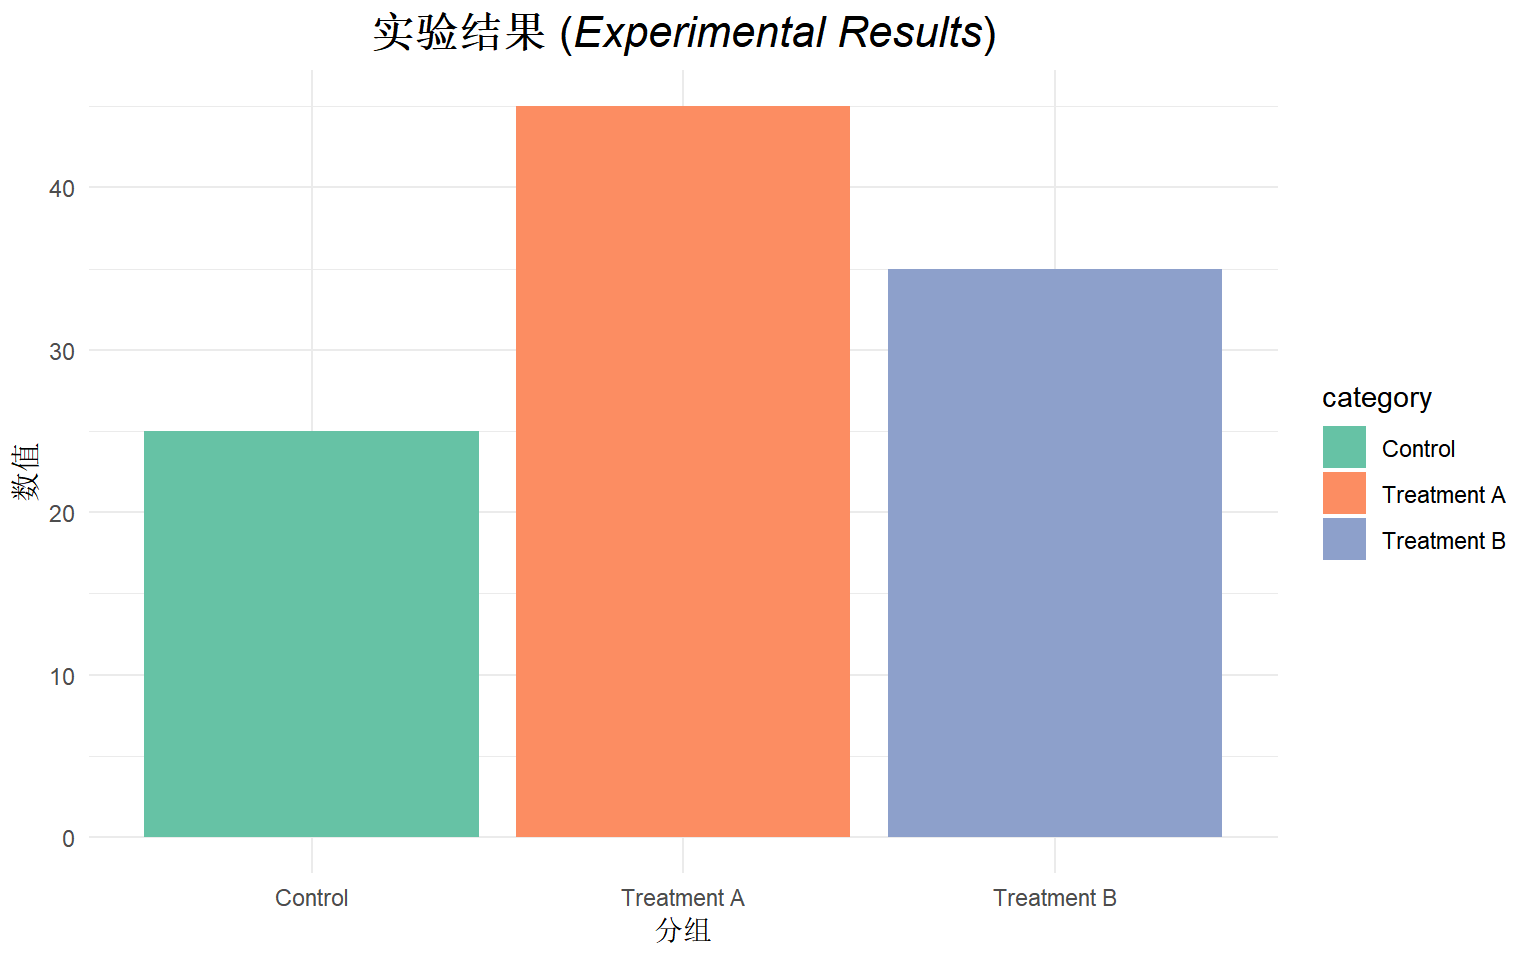
支持的 Markdown 语法
| 语法 | 效果 | 示例 |
|---|---|---|
**text** |
粗体 | 粗体文字 |
*text* |
斜体 | 斜体文字 |
<sup>text</sup> |
上标 | R2 |
<sub>text</sub> |
下标 | H2O |
<span style='color:red'> |
颜色 | 红色文字 |
<br> |
换行 | 多行文本 |
ggplot(data, aes(x = category, y = value, fill = category)) +
  geom_col() +
  labs(
    title = "H<sub>2</sub>O 含量与 CO<sub>2</sub> 浓度",
    subtitle = "相关系数 R<sup>2</sup> = 0.95"
  ) +
  theme_minimal() +
  theme(
    plot.title = element_markdown(size = 14, hjust = 0.5),
    plot.subtitle = element_markdown(size = 11, hjust = 0.5, color = "gray50")
  ) +
  scale_fill_brewer(palette = "Pastel1")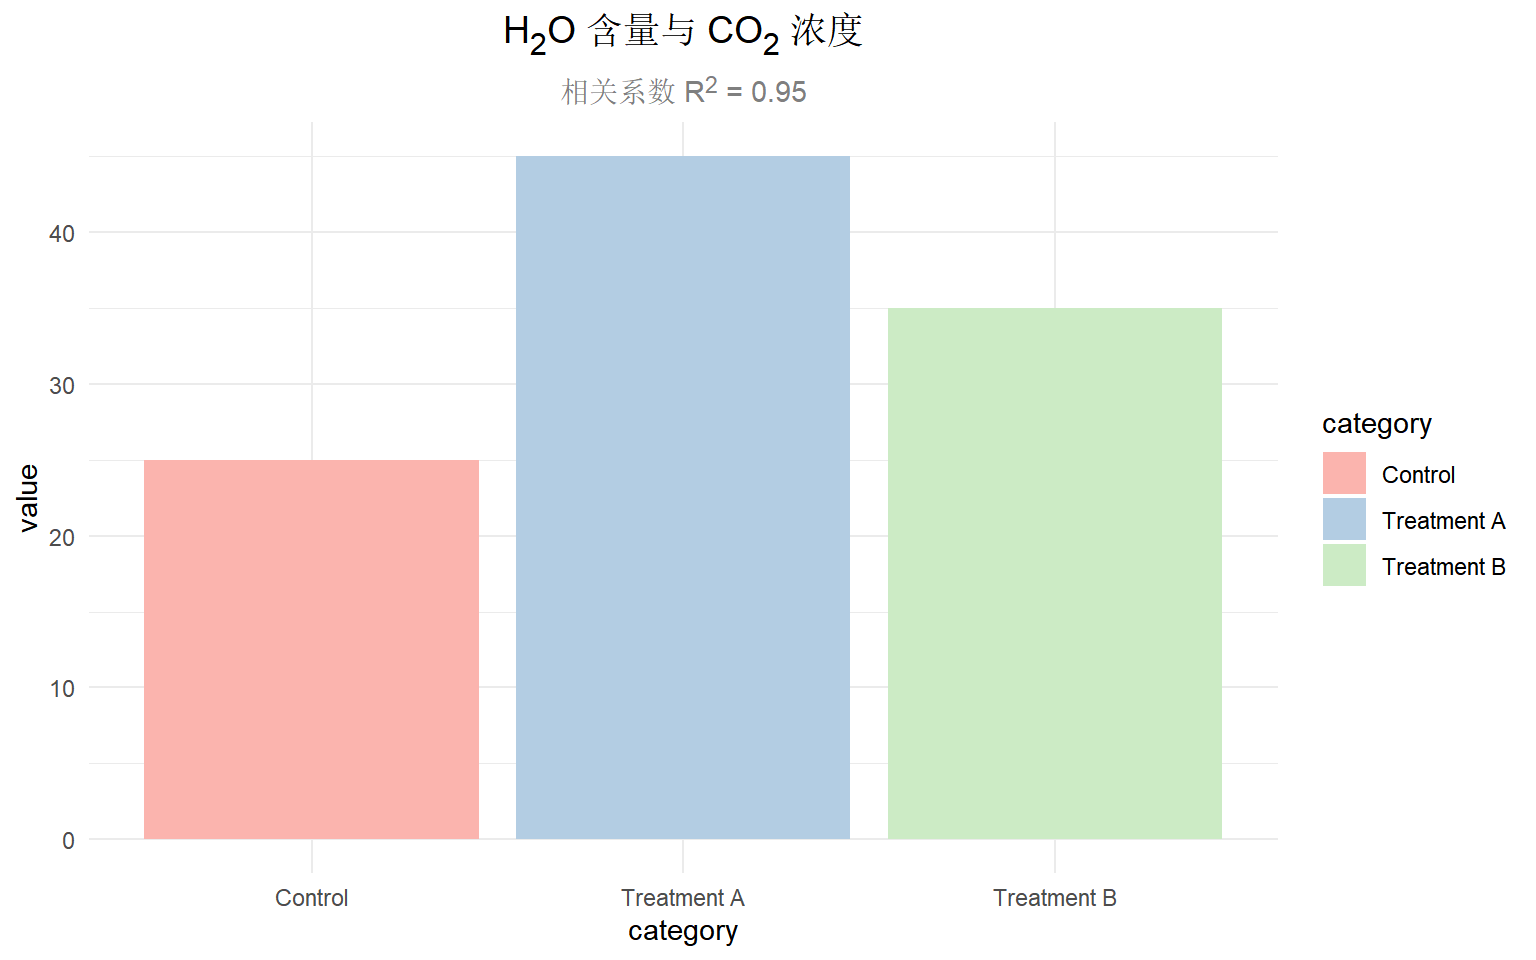
中英文混合字体设置
核心原理
ggtext 使用 CSS 语法来指定字体,通过 <span style='font-family:...'> 可以为不同文字指定不同字体。
基础示例:中英文分别设置字体
# 创建带中英文标签的数据
df <- data.frame(
  group = c("对照组\nControl", "治疗组A\nTreatment A", "治疗组B\nTreatment B"),
  mean_value = c(23.5, 45.2, 38.7)
)

ggplot(df, aes(x = group, y = mean_value, fill = group)) +
  geom_col(width = 0.7) +
  labs(
    title = "<span style='font-family:SimHei'>临床试验结果</span> <span style='font-family:Arial'>Clinical Trial Results</span>",
    x = NULL,
    y = "<span style='font-family:SimSun'>数值</span> (Value)"
  ) +
  theme_bw(base_size = 12) +
  theme(
    plot.title = element_markdown(size = 16, hjust = 0.5),
    axis.title.y = element_markdown(),
    legend.position = "none"
  ) +
  scale_fill_brewer(palette = "Blues")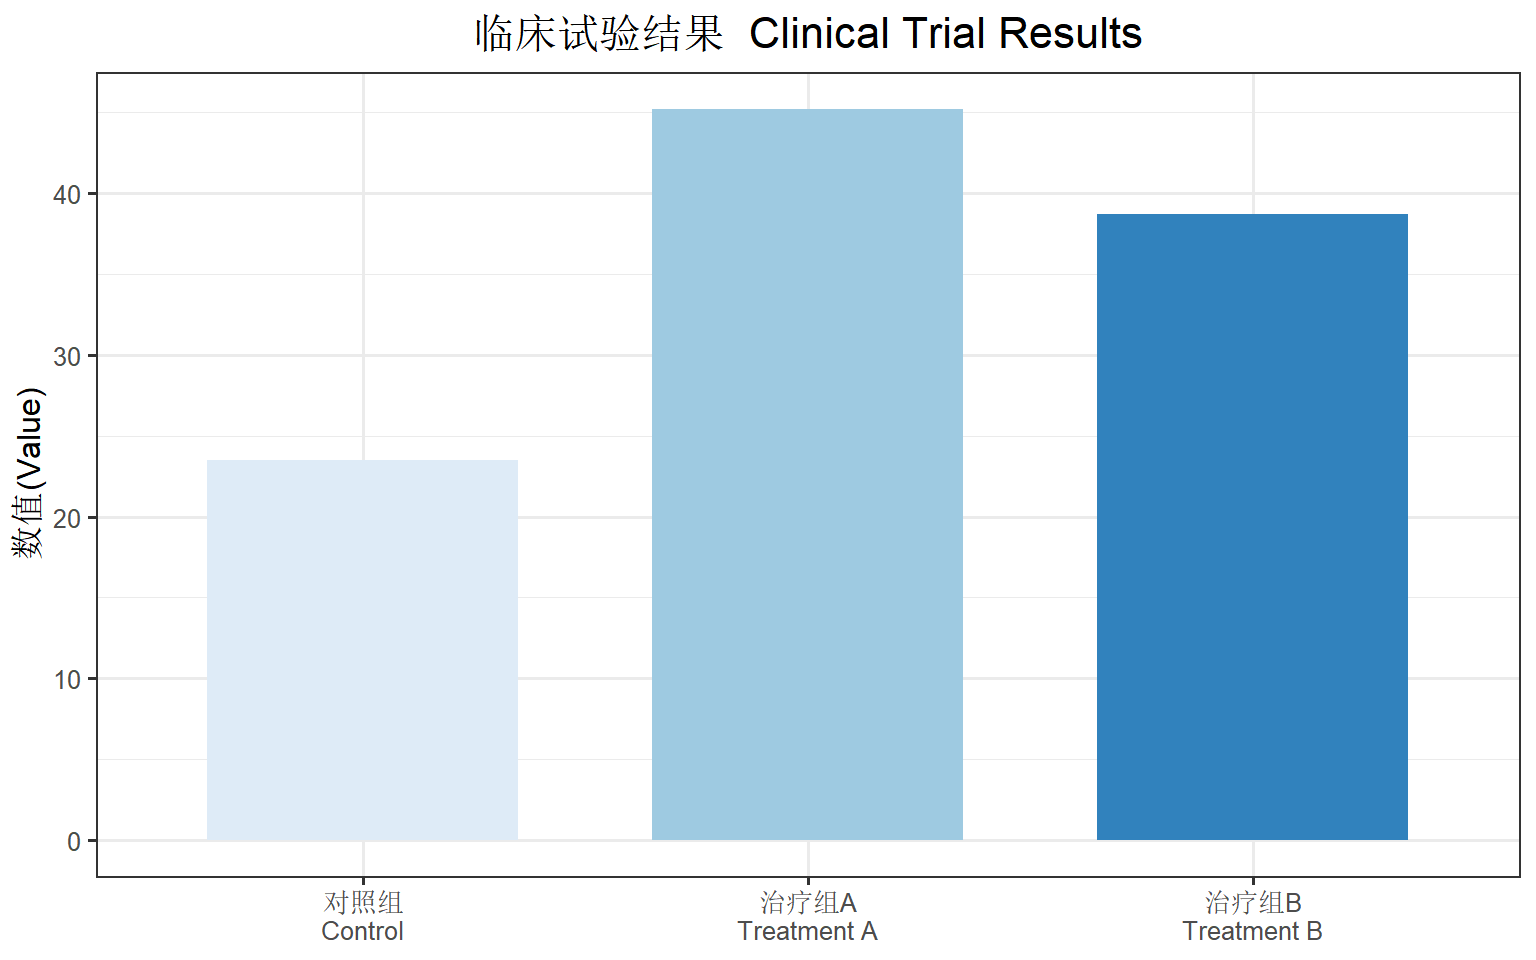
推荐的中英文字体搭配
| 用途 | 中文字体 | 英文字体 | 效果 |
|---|---|---|---|
| 正文 | SimSun (宋体) | Times New Roman | 学术规范 |
| 标题 | SimHei (黑体) | Arial | 醒目清晰 |
| 强调 | Microsoft YaHei (微软雅黑) | Helvetica | 现代简洁 |
| 代码 | SimSun | Consolas | 等宽整齐 |
创建便捷函数
为了简化中英文混合字体的设置,我们可以创建辅助函数:
# 中英文混合文本格式化函数
format_cn_en <- function(cn_text, en_text,
                         cn_font = "SimHei",
                         en_font = "Arial",
                         cn_color = "black",
                         en_color = "gray30") {
  glue::glue(
    "<span style='font-family:{cn_font}; color:{cn_color}'>{cn_text}</span> ",
    "<span style='font-family:{en_font}; color:{en_color}; font-style:italic'>{en_text}</span>"
  )
}

# 使用示例
title_text <- format_cn_en("生存分析结果", "Survival Analysis")

ggplot(mtcars, aes(x = factor(cyl), y = mpg, fill = factor(cyl))) +
  geom_boxplot() +
  labs(title = title_text) +
  theme_bw() +
  theme(
    plot.title = element_markdown(size = 14, hjust = 0.5),
    legend.position = "none"
  ) +
  scale_fill_brewer(palette = "Set2")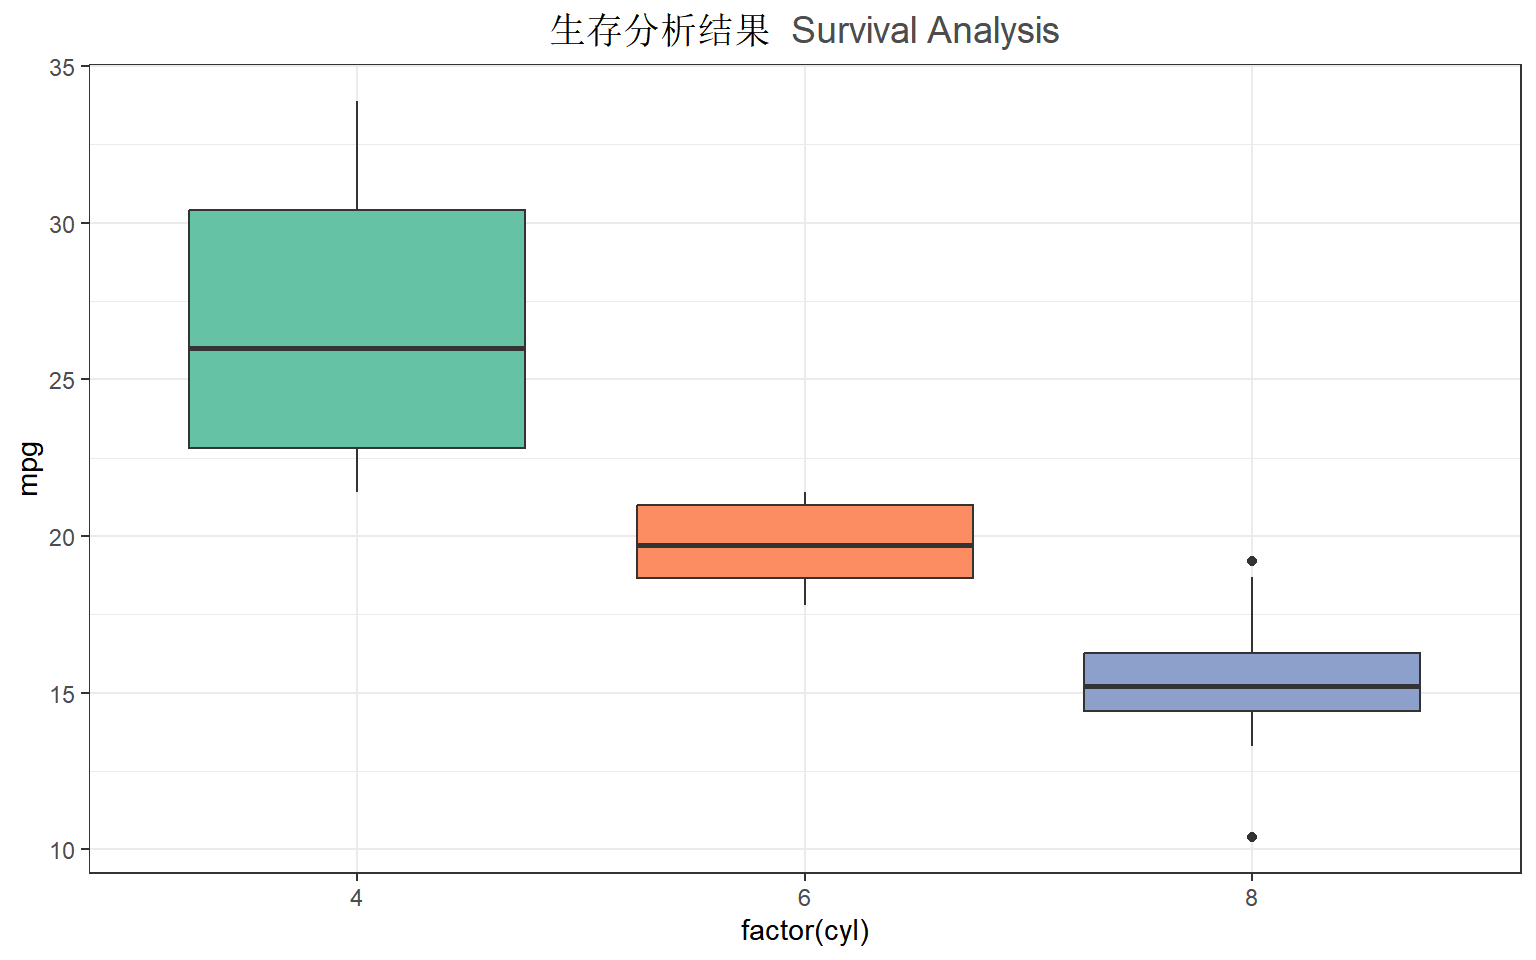
高级应用:彩色坐标轴标签
按分组着色的 X 轴标签
# 创建数据,标签包含颜色信息
iris_summary <- iris |>
  group_by(Species) |>
  summarise(mean_length = mean(Sepal.Length), .groups = "drop") |>
  mutate(
    # 为每个物种创建带颜色的标签
    colored_label = case_when(
      Species == "setosa" ~ "<span style='color:#E41A1C'>**Setosa** 山鸢尾</span>",
      Species == "versicolor" ~ "<span style='color:#377EB8'>**Versicolor** 变色鸢尾</span>",
      Species == "virginica" ~ "<span style='color:#4DAF4A'>**Virginica** 维吉尼亚鸢尾</span>"
    )
  )

ggplot(iris_summary, aes(x = colored_label, y = mean_length, fill = Species)) +
  geom_col(width = 0.6) +
  labs(
    title = "鸢尾花萼片长度比较",
    x = NULL,
    y = "平均萼片长度 (cm)"
  ) +
  theme_bw(base_size = 12) +
  theme(
    plot.title = element_text(hjust = 0.5, face = "bold"),
    axis.text.x = element_markdown(size = 11),
    legend.position = "none"
  ) +
  scale_fill_manual(values = c("#E41A1C", "#377EB8", "#4DAF4A"))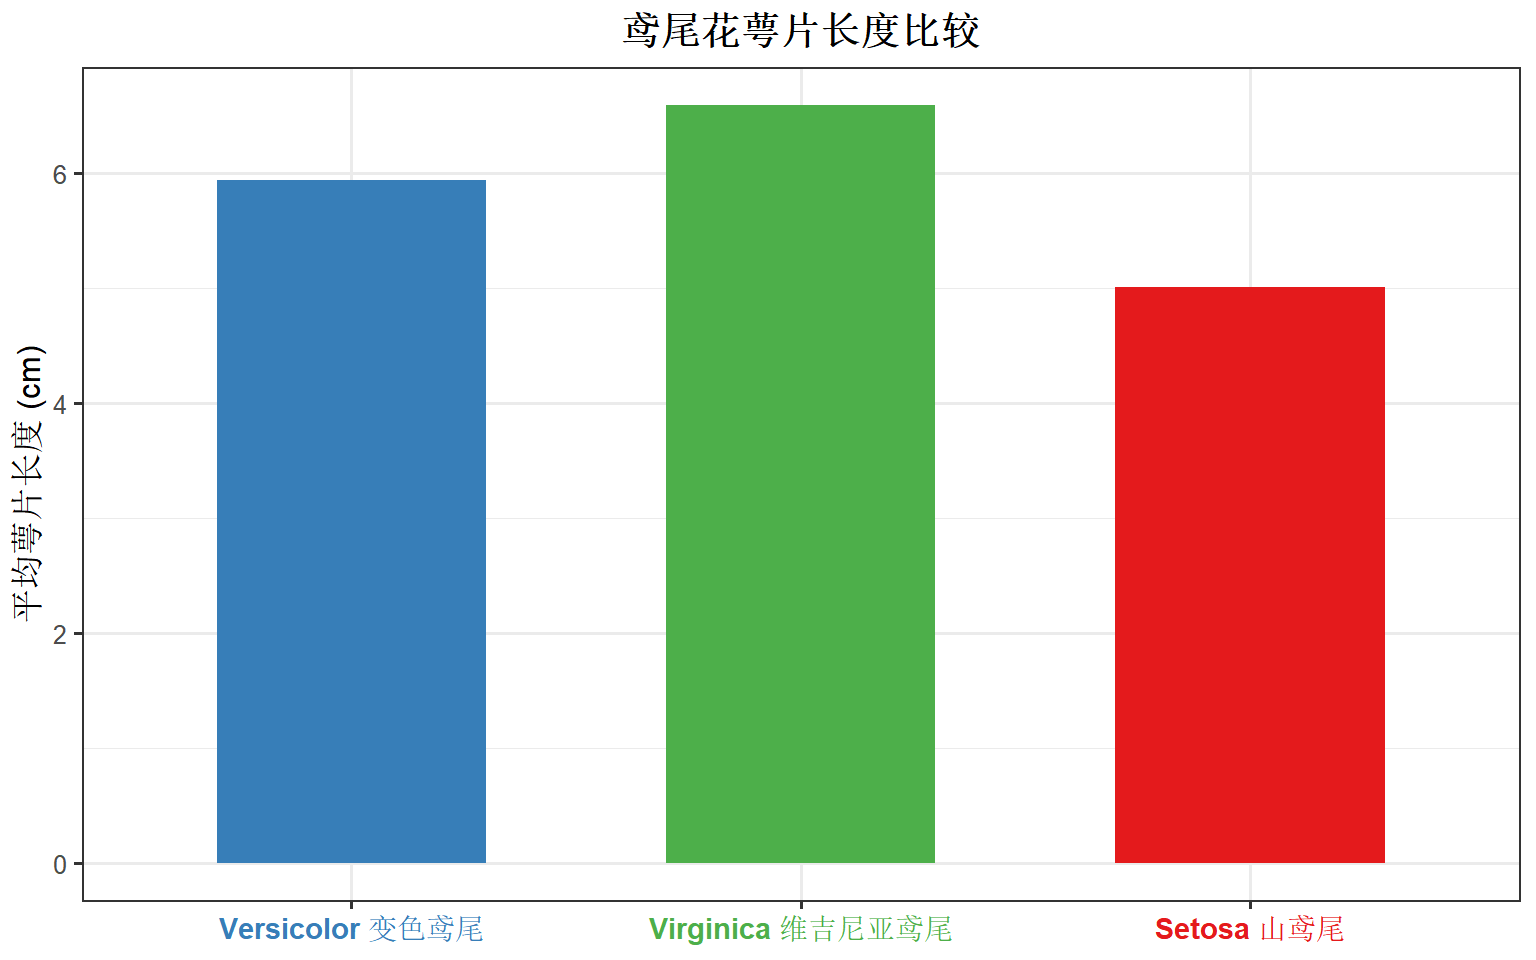
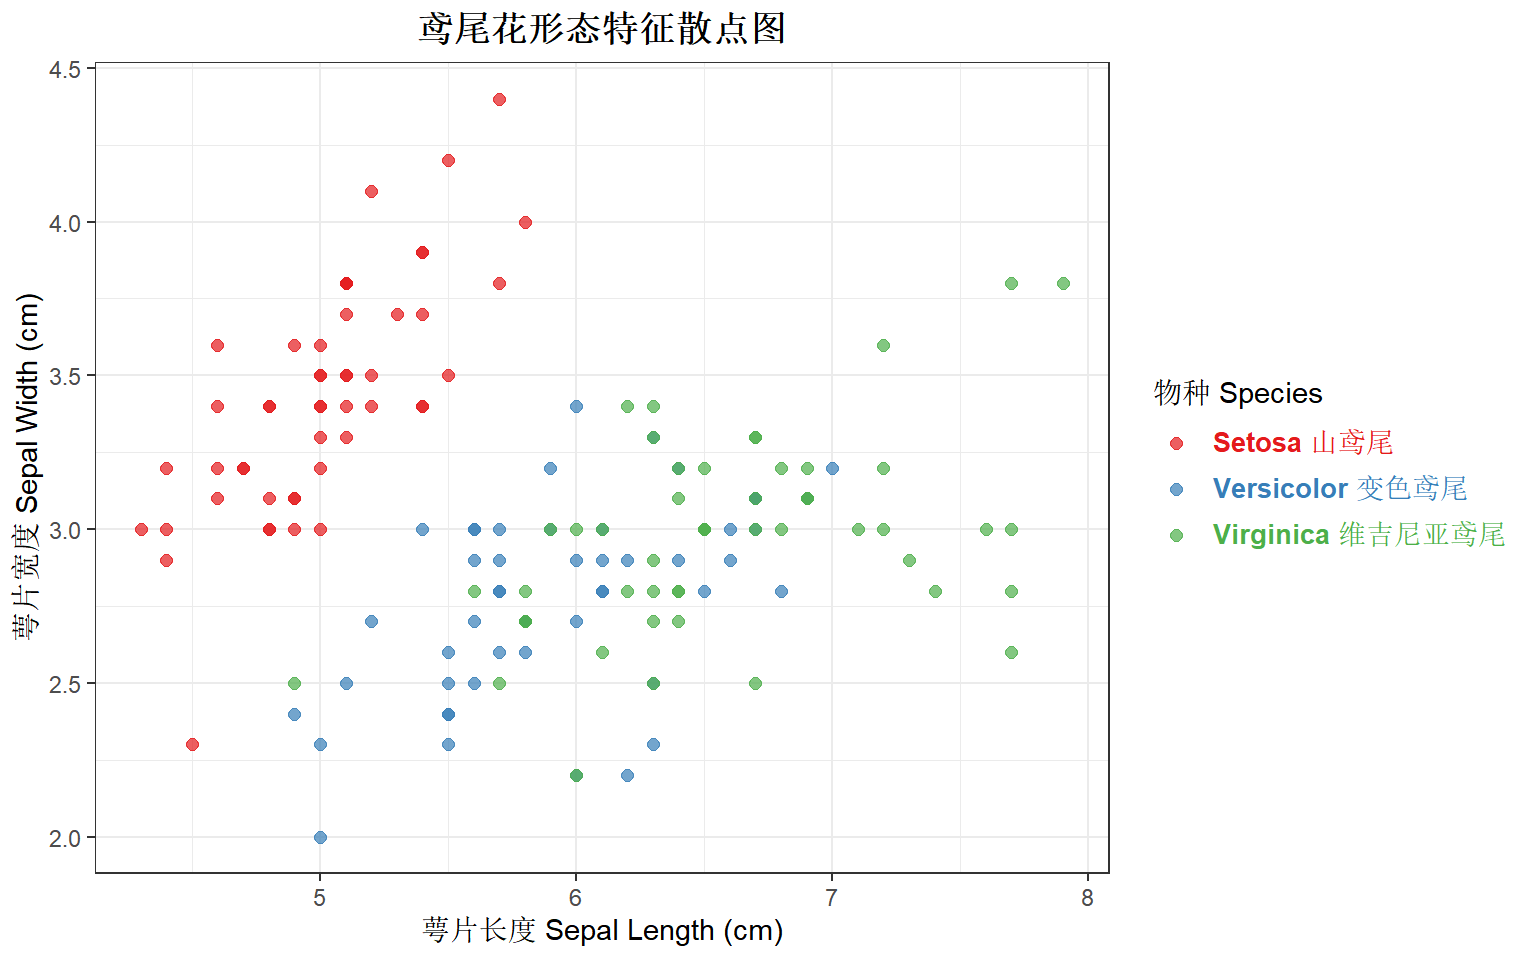
彩色图例文字
# 使用 ggtext 美化图例
ggplot(iris, aes(x = Sepal.Length, y = Sepal.Width, color = Species)) +
  geom_point(size = 2, alpha = 0.7) +
  scale_color_manual(
    values = c("setosa" = "#E41A1C", "versicolor" = "#377EB8", "virginica" = "#4DAF4A"),
    labels = c(
      "setosa" = "<span style='color:#E41A1C'>**Setosa** 山鸢尾</span>",
      "versicolor" = "<span style='color:#377EB8'>**Versicolor** 变色鸢尾</span>",
      "virginica" = "<span style='color:#4DAF4A'>**Virginica** 维吉尼亚鸢尾</span>"
    )
  ) +
  labs(
    title = "鸢尾花形态特征散点图",
    x = "萼片长度 Sepal Length (cm)",
    y = "萼片宽度 Sepal Width (cm)",
    color = "物种 Species"
  ) +
  theme_bw() +
  theme(
    plot.title = element_text(hjust = 0.5, face = "bold"),
    legend.text = element_markdown(size = 10)
  )
文本框:geom_richtext() 和 geom_textbox()
geom_richtext():富文本标注
# 在图中添加富文本标注
df_annotation <- data.frame(
  x = 6.5,
  y = 4.2,
  label = "**最大值点**<br><span style='color:red; font-size:10pt'>*Sepal.Length* = 7.9</span>"
)

ggplot(iris, aes(x = Sepal.Length, y = Sepal.Width)) +
  geom_point(aes(color = Species), alpha = 0.6) +
  geom_richtext(
    data = df_annotation,
    aes(x = x, y = y, label = label),
    fill = "white",
    label.color = "gray50",
    hjust = 0
  ) +
  labs(title = "使用 geom_richtext 添加标注") +
  theme_bw() +
  theme(plot.title = element_text(hjust = 0.5)) +
  scale_color_brewer(palette = "Set1")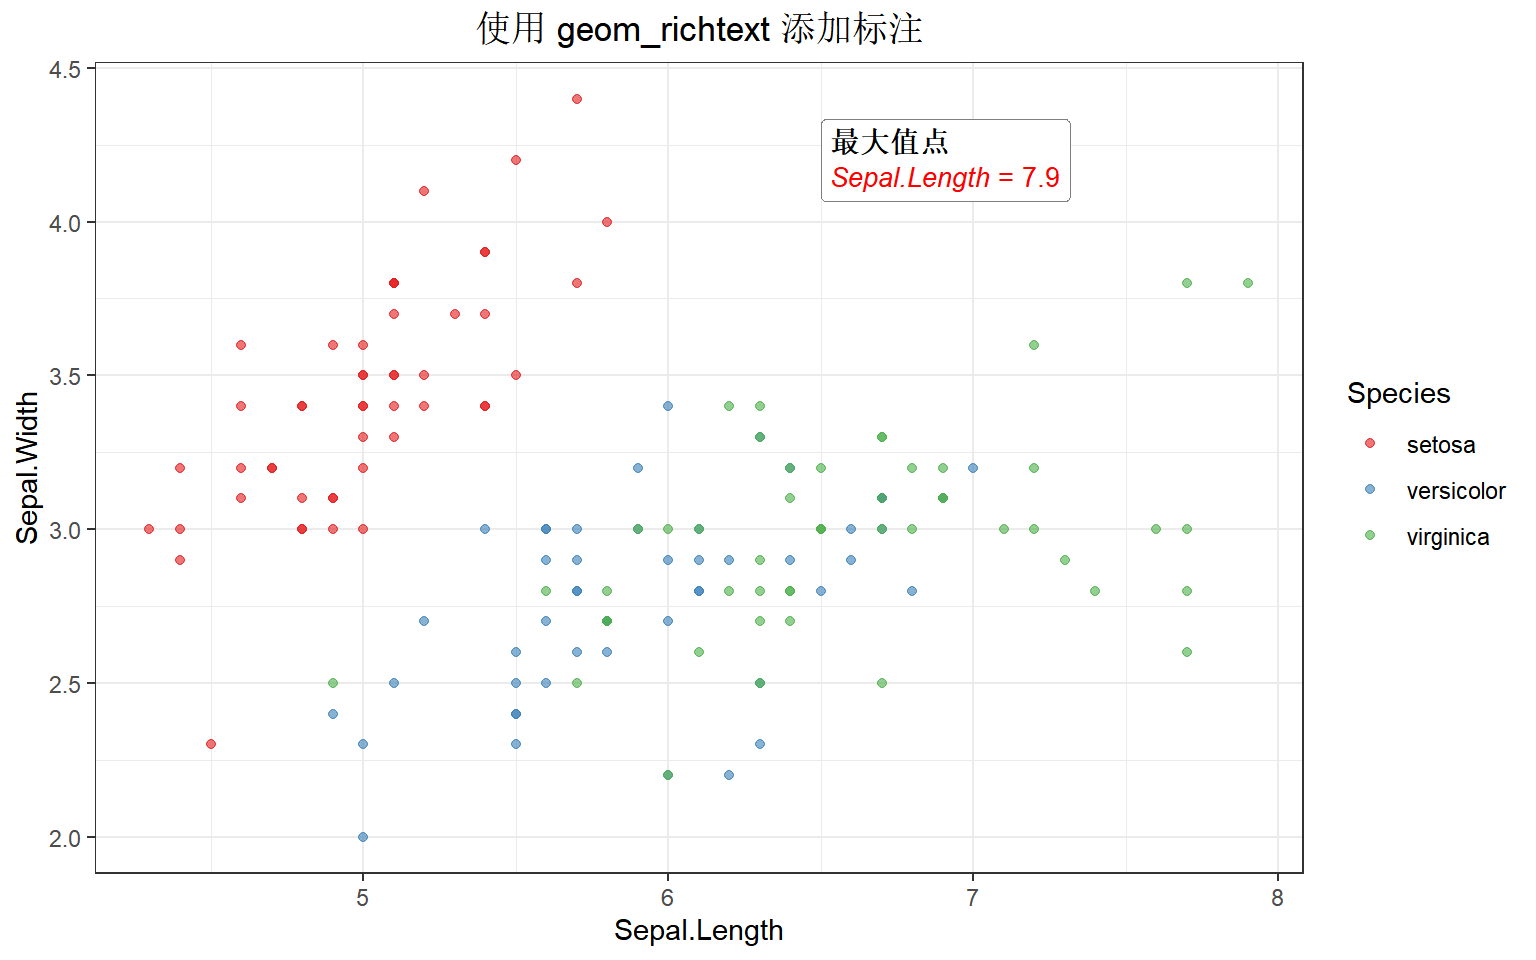
geom_textbox():文本框
# 添加可换行的文本框
long_text <- "这是一段较长的说明文字,使用 **geom_textbox** 可以实现自动换行。支持 *Markdown* 语法和 <span style='color:blue'>HTML 样式</span>。"

ggplot(mtcars, aes(x = wt, y = mpg)) +
  geom_point(aes(color = factor(cyl))) +
  geom_textbox(
    aes(x = 4.5, y = 30, label = long_text),
    width = unit(5, "cm"),
    fill = "lightyellow",
    box.color = "orange",
    hjust = 0.5
  ) +
  labs(title = "使用 geom_textbox 添加说明") +
  theme_bw() +
  theme(plot.title = element_text(hjust = 0.5)) +
  scale_color_brewer(palette = "Dark2", name = "气缸数")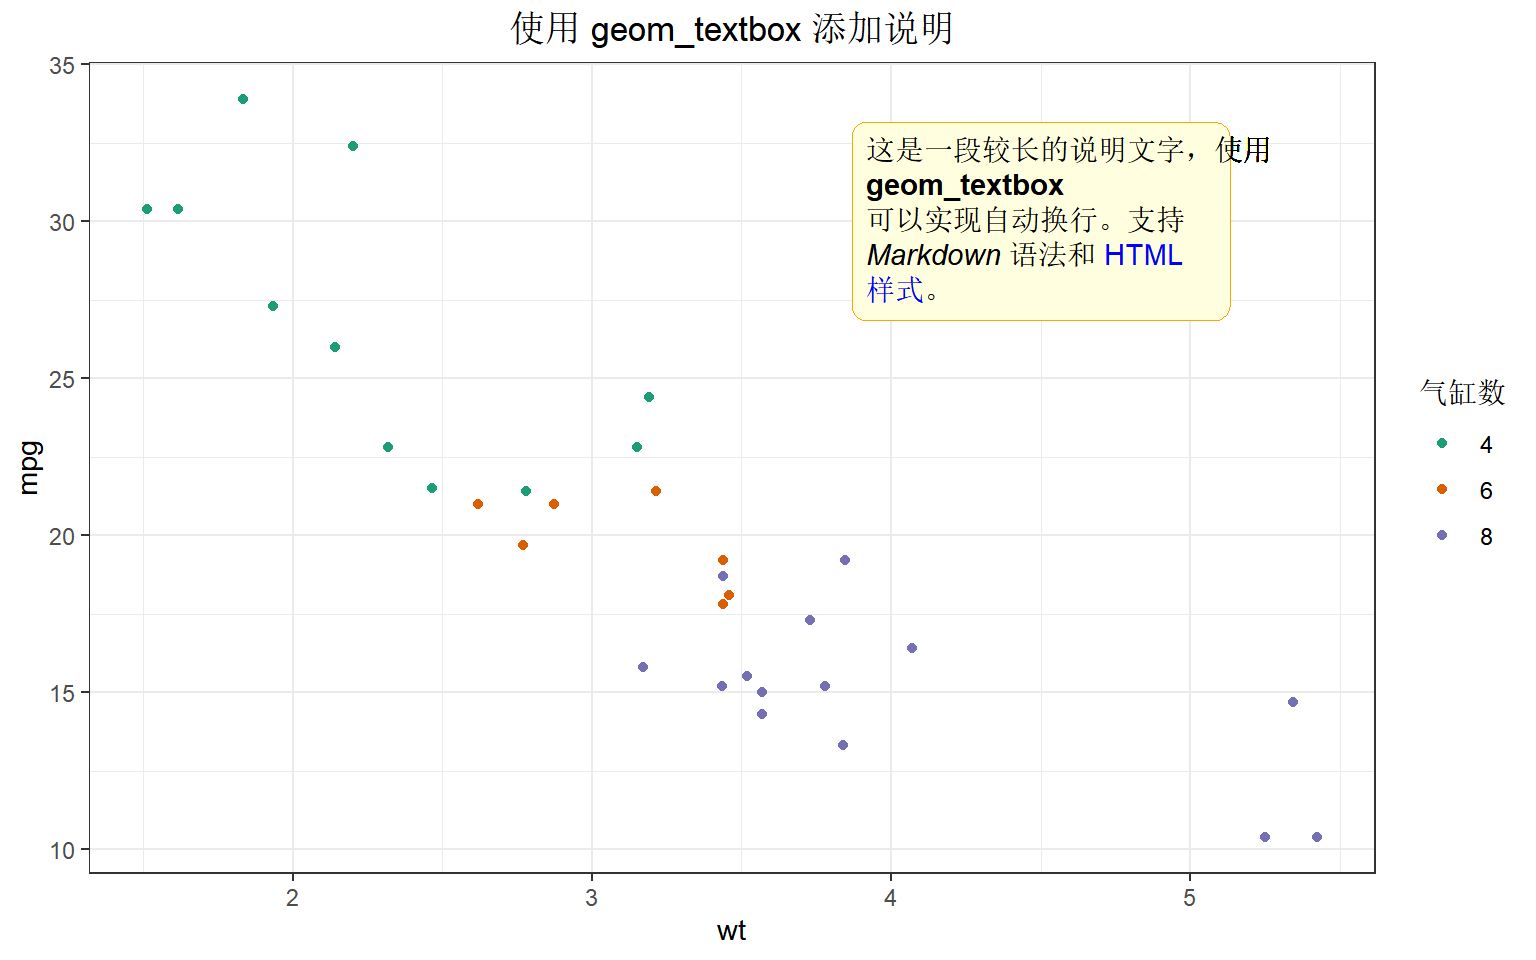
实战案例:完整的中英文混合图表
案例1:临床试验结果图
# 模拟临床数据
set.seed(42)
clinical_data <- data.frame(
  group = rep(c("安慰剂组\nPlacebo", "低剂量组\nLow Dose", "高剂量组\nHigh Dose"), each = 30),
  response = c(
    rnorm(30, 50, 10),
    rnorm(30, 60, 12),
    rnorm(30, 75, 8)
  )
)

# 计算汇总统计
summary_data <- clinical_data |>
  group_by(group) |>
  summarise(
    mean_val = mean(response),
    se = sd(response) / sqrt(n()),
    .groups = "drop"
  )

# 创建图表
p_clinical <- ggplot(summary_data, aes(x = group, y = mean_val, fill = group)) +
  geom_col(width = 0.6, color = "black", linewidth = 0.3) +
  geom_errorbar(
    aes(ymin = mean_val - se, ymax = mean_val + se),
    width = 0.2
  ) +
  labs(
    title = "<span style='font-family:SimHei; font-size:16pt'>**药物疗效评估**</span><br><span style='font-family:Arial; color:gray40; font-size:12pt'>*Drug Efficacy Assessment*</span>",
    x = NULL,
    y = "<span style='font-family:SimSun'>应答率 (%)</span> <span style='font-family:Arial; color:gray50'>Response Rate</span>"
  ) +
  theme_bw(base_size = 11) +
  theme(
    plot.title = element_markdown(hjust = 0.5, lineheight = 1.2),
    axis.title.y = element_markdown(),
    axis.text.x = element_text(size = 10),
    legend.position = "none"
  ) +
  scale_fill_brewer(palette = "Blues") +
  scale_y_continuous(expand = expansion(mult = c(0, 0.1)))

p_clinical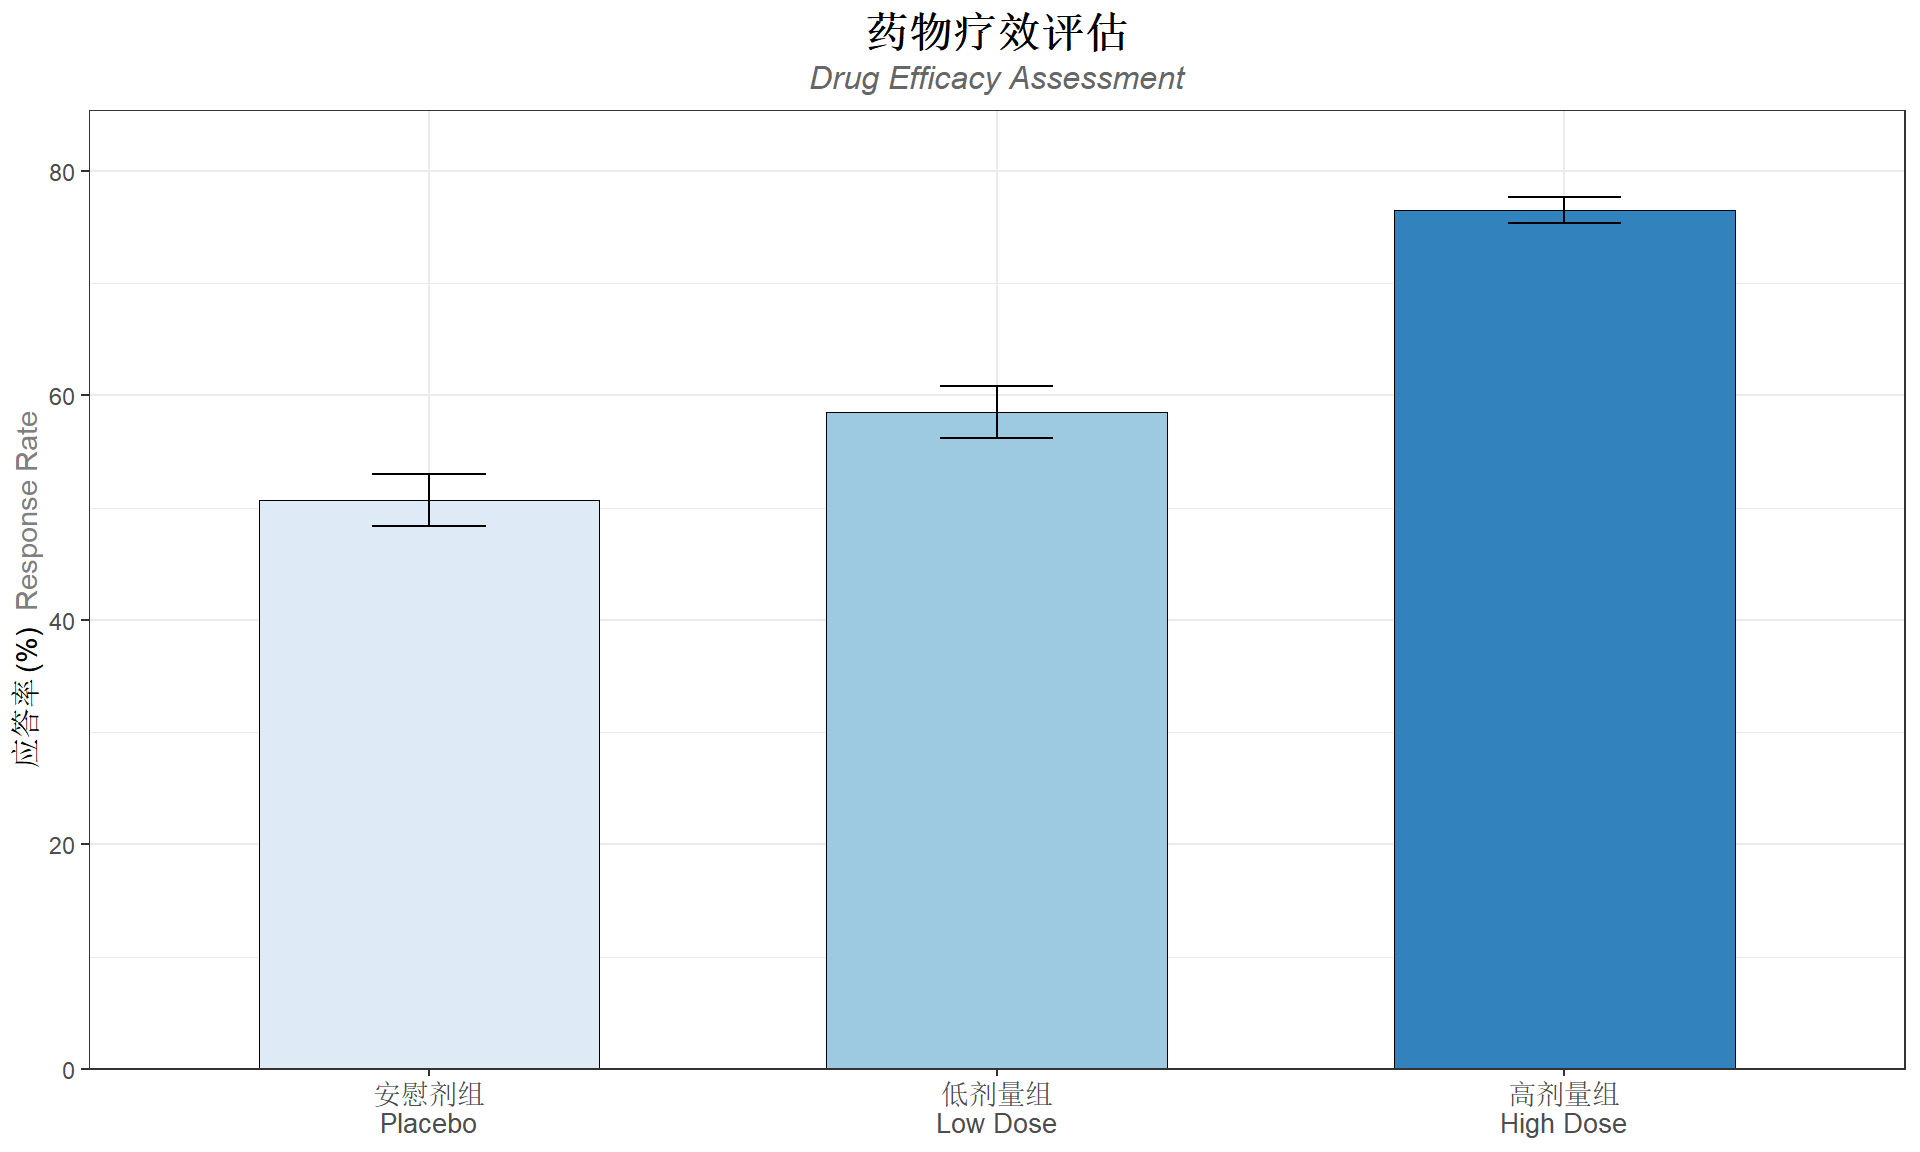
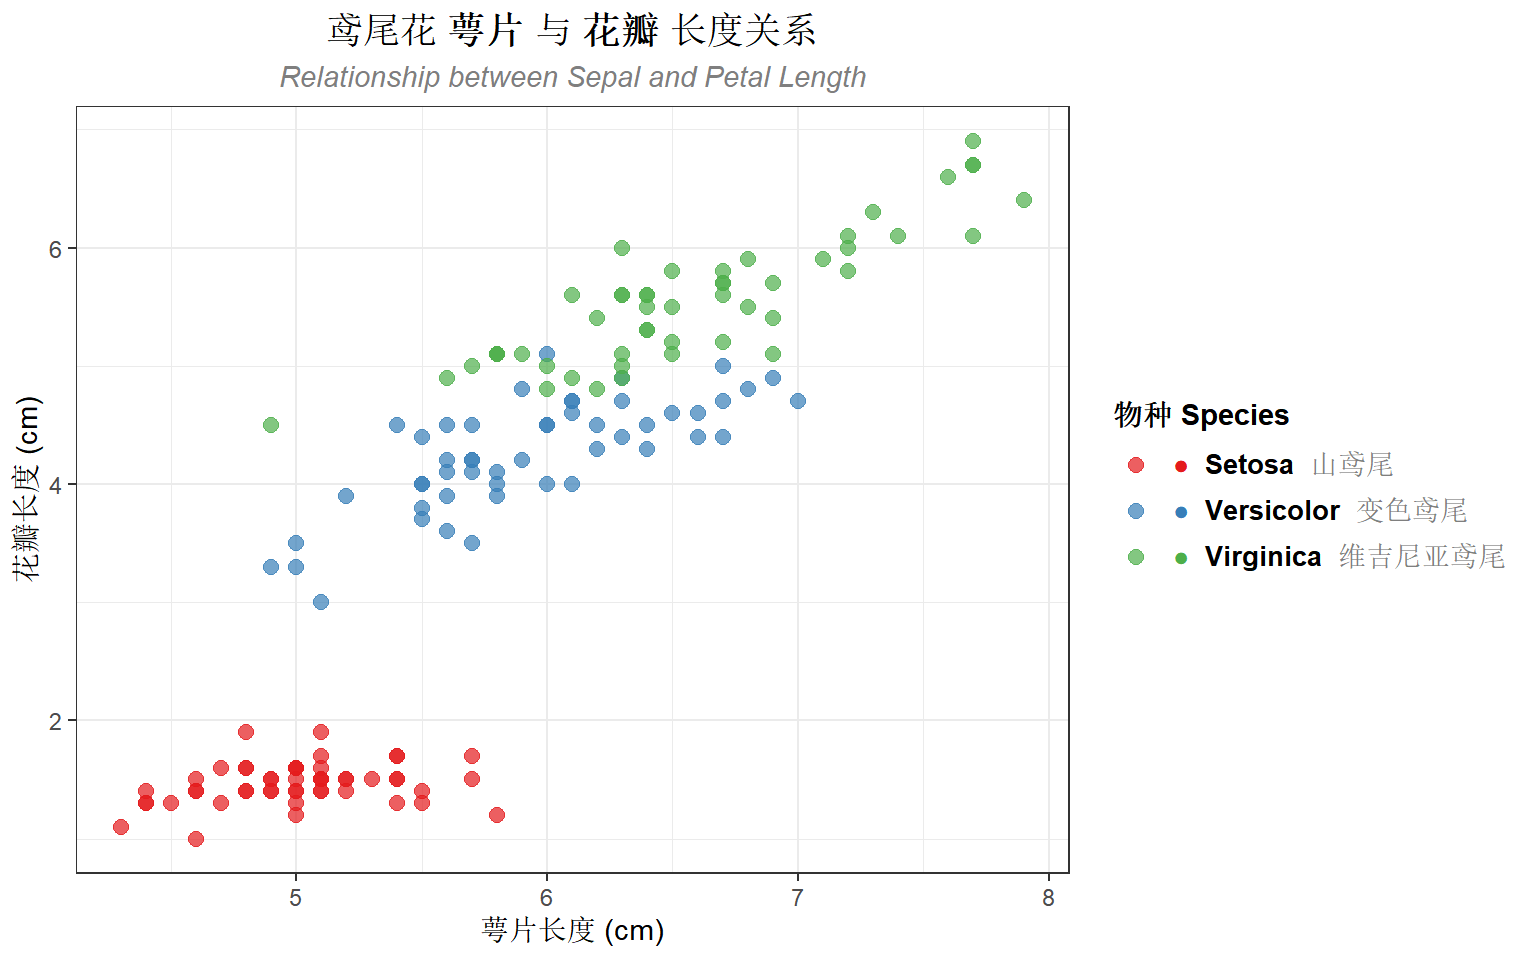
案例2:带图片的图例
# 创建自定义图例标签(模拟带图标效果)
legend_labels <- c(
  "setosa" = "<span style='color:#E41A1C'>●</span> **Setosa** <span style='color:gray50'>山鸢尾</span>",
  "versicolor" = "<span style='color:#377EB8'>●</span> **Versicolor** <span style='color:gray50'>变色鸢尾</span>",
  "virginica" = "<span style='color:#4DAF4A'>●</span> **Virginica** <span style='color:gray50'>维吉尼亚鸢尾</span>"
)

ggplot(iris, aes(x = Sepal.Length, y = Petal.Length, color = Species)) +
  geom_point(size = 2.5, alpha = 0.7) +
  scale_color_manual(
    values = c("setosa" = "#E41A1C", "versicolor" = "#377EB8", "virginica" = "#4DAF4A"),
    labels = legend_labels
  ) +
  labs(
    title = "鸢尾花 **萼片** 与 **花瓣** 长度关系",
    subtitle = "*Relationship between Sepal and Petal Length*",
    x = "萼片长度 (cm)",
    y = "花瓣长度 (cm)",
    color = "物种 Species"
  ) +
  theme_bw() +
  theme(
    plot.title = element_markdown(size = 14, hjust = 0.5),
    plot.subtitle = element_markdown(size = 11, hjust = 0.5, color = "gray50"),
    legend.text = element_markdown(size = 10),
    legend.title = element_text(face = "bold")
  )
常见问题与解决方案
1. 字体不显示
# 检查系统可用字体
windowsFonts()

# 查看特定字体是否可用
library(systemfonts)
system_fonts() |>
  filter(grepl("Sim|Microsoft", family, ignore.case = TRUE))
2. PDF 导出中文乱码
# 使用 ragg 包导出 PNG(推荐)
ggsave("figure.png", plot = p, device = ragg::agg_png, dpi = 300)

# PDF 使用 cairo_pdf
ggsave("figure.pdf", plot = p, device = cairo_pdf)
3. element_markdown 与 element_text 的区别
| 特性 | element_text() | element_markdown() |
|---|---|---|
| 纯文本 | ✓ | ✓ |
| 粗体/斜体 | face 参数 | Markdown 语法 |
| 颜色 | color 参数 | HTML span 标签 |
| 多字体 | ✗ | ✓ |
| 上下标 | ✗ | ✓ |
总结
ggtext 包的核心功能:
- element_markdown():在主题元素中使用 Markdown/HTML
- geom_richtext():在图中添加富文本标注
- geom_textbox():添加可换行的文本框
- 中英文混合:通过 CSS
font-family属性实现
推荐的工作流程:
- 使用
glue包构建复杂的 HTML 字符串 - 创建辅助函数简化重复操作
- 使用
ragg包导出确保中文正常显示
参考资源: